

Phenotypic and molecular characterization of the claudin-low intrinsic subtype of breast cancer
- PMID: 20813035
- PMCID: PMC3096954
- DOI: 10.1186/bcr2635
Phenotypic and molecular characterization of the claudin-low intrinsic subtype of breast cancer
Abstract
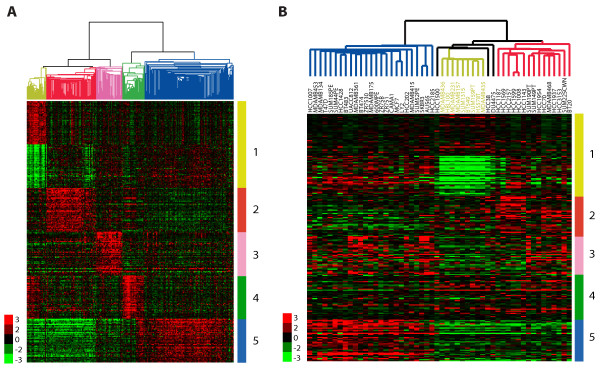
Introduction: In breast cancer, gene expression analyses have defined five tumor subtypes (luminal A, luminal B, HER2-enriched, basal-like and claudin-low), each of which has unique biologic and prognostic features. Here, we comprehensively characterize the recently identified claudin-low tumor subtype.
Methods: The clinical, pathological and biological features of claudin-low tumors were compared to the other tumor subtypes using an updated human tumor database and multiple independent data sets. These main features of claudin-low tumors were also evaluated in a panel of breast cancer cell lines and genetically engineered mouse models.
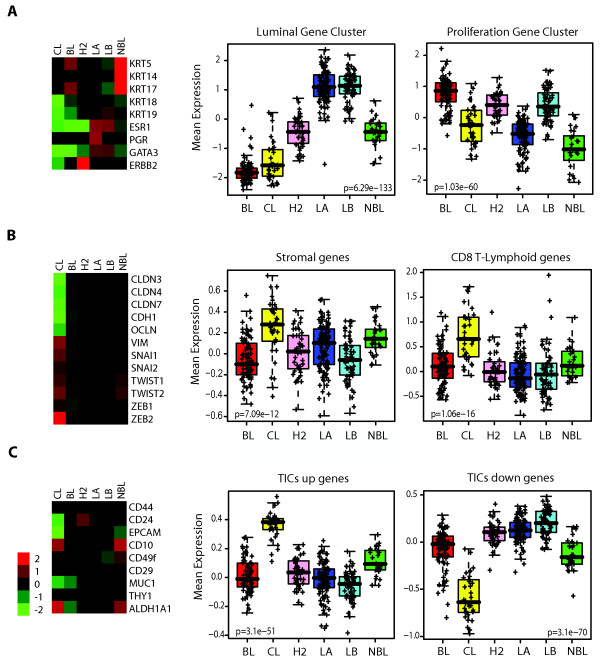
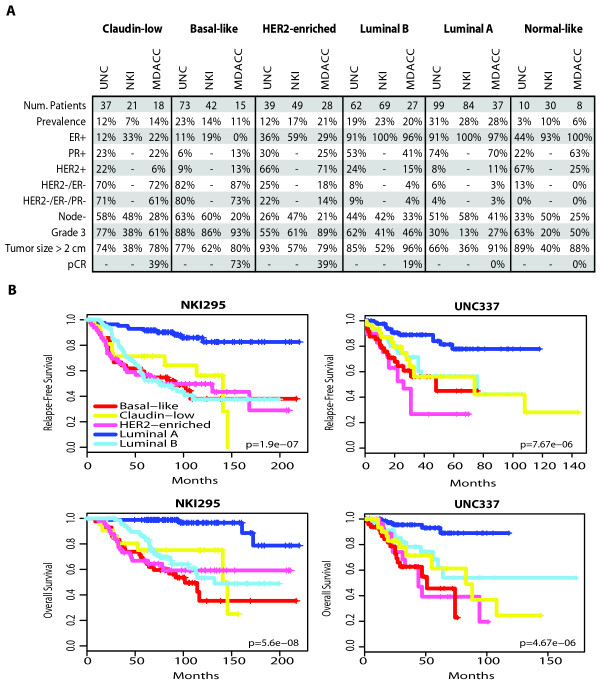
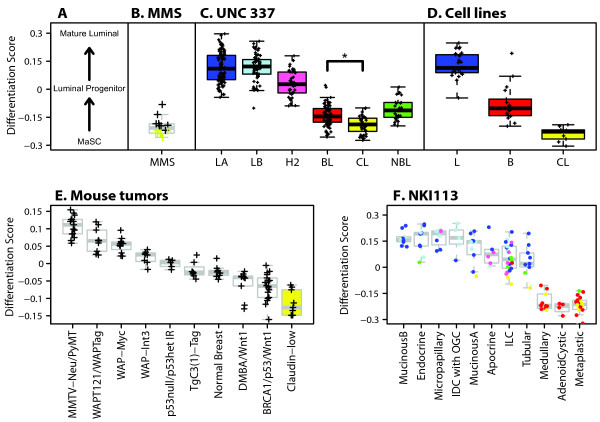
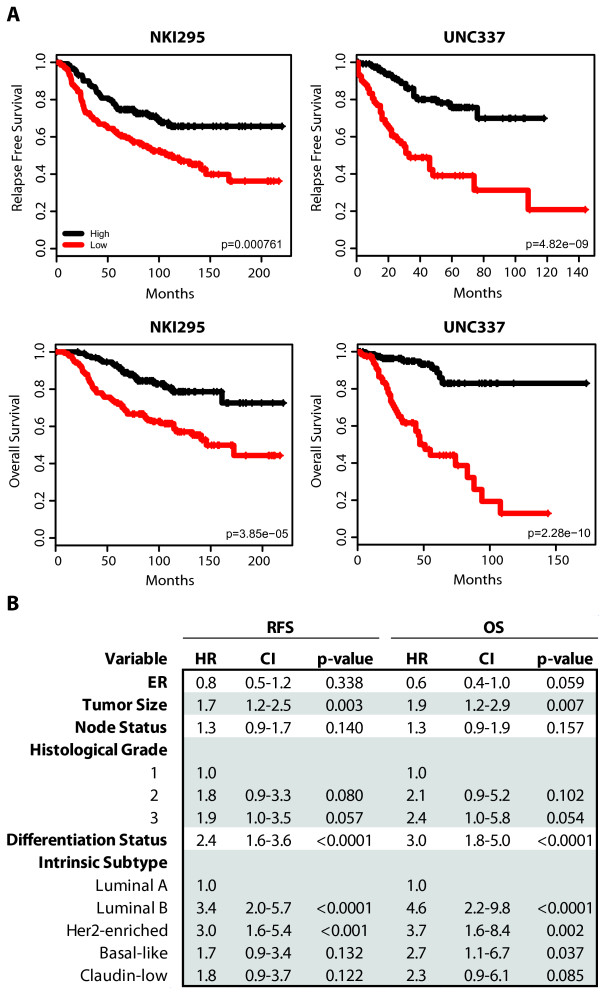
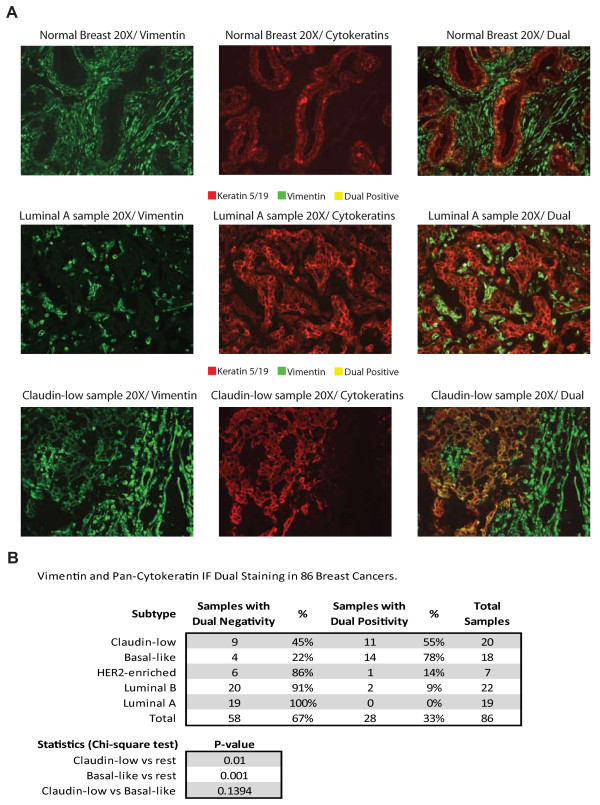
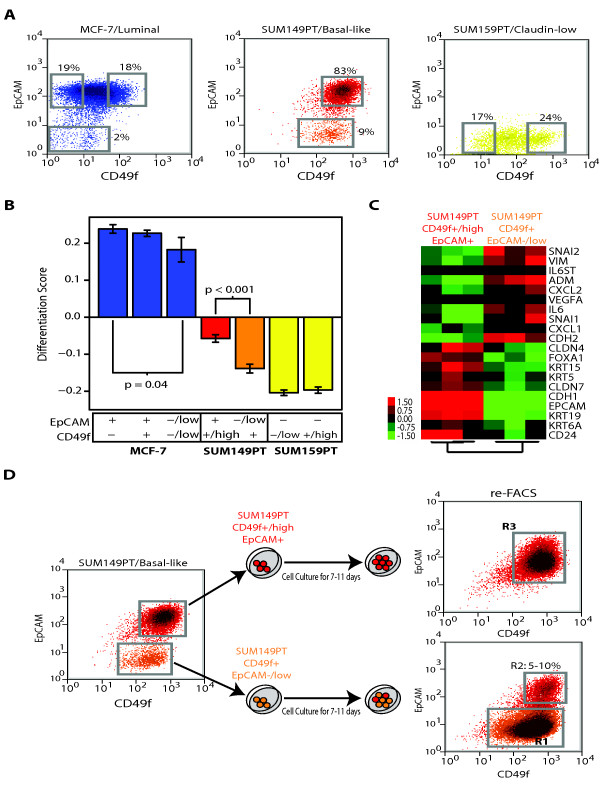
Results: Claudin-low tumors are characterized by the low to absent expression of luminal differentiation markers, high enrichment for epithelial-to-mesenchymal transition markers, immune response genes and cancer stem cell-like features. Clinically, the majority of claudin-low tumors are poor prognosis estrogen receptor (ER)-negative, progesterone receptor (PR)-negative, and epidermal growth factor receptor 2 (HER2)-negative (triple negative) invasive ductal carcinomas with a high frequency of metaplastic and medullary differentiation. They also have a response rate to standard preoperative chemotherapy that is intermediate between that of basal-like and luminal tumors. Interestingly, we show that a group of highly utilized breast cancer cell lines, and several genetically engineered mouse models, express the claudin-low phenotype. Finally, we confirm that a prognostically relevant differentiation hierarchy exists across all breast cancers in which the claudin-low subtype most closely resembles the mammary epithelial stem cell.
Conclusions: These results should help to improve our understanding of the biologic heterogeneity of breast cancer and provide tools for the further evaluation of the unique biology of claudin-low tumors and cell lines.
Figures
Similar articles
-
Claudin expression in high-grade invasive ductal carcinoma of the breast: correlation with the molecular subtype.Mod Pathol. 2013 Apr;26(4):485-95. doi: 10.1038/modpathol.2012.187. Epub 2012 Dec 7. Mod Pathol. 2013. PMID: 23222490 Free PMC article.
-
Characterization of cell lines derived from breast cancers and normal mammary tissues for the study of the intrinsic molecular subtypes.Breast Cancer Res Treat. 2013 Nov;142(2):237-55. doi: 10.1007/s10549-013-2743-3. Epub 2013 Oct 27. Breast Cancer Res Treat. 2013. PMID: 24162158 Free PMC article.
-
Claudin-low breast cancers: clinical, pathological, molecular and prognostic characterization.Mol Cancer. 2014 Oct 2;13:228. doi: 10.1186/1476-4598-13-228. Mol Cancer. 2014. PMID: 25277734 Free PMC article.
-
Mouse models of triple negative [basal-like/claudin low] breast cancer.Breast Dis. 2010;32(1-2):63-71. doi: 10.3233/BD-2010-0321. Breast Dis. 2010. PMID: 21965308 Review.
-
In search of triple-negative DCIS: tumor-type dependent model of breast cancer progression from DCIS to the invasive cancer.Tumour Biol. 2013 Feb;34(1):1-7. doi: 10.1007/s13277-012-0602-1. Epub 2012 Dec 4. Tumour Biol. 2013. PMID: 23208673 Review.
Cited by
-
Can pharmacological receptor tyrosine kinase inhibitors sensitize poor outcome breast tumors to immune-based therapies?Front Oncol. 2013 Feb 13;3:23. doi: 10.3389/fonc.2013.00023. eCollection 2013. Front Oncol. 2013. PMID: 23408142 Free PMC article.
-
Claudins in cancer: bench to bedside.Pflugers Arch. 2017 Jan;469(1):55-67. doi: 10.1007/s00424-016-1877-7. Epub 2016 Sep 13. Pflugers Arch. 2017. PMID: 27624415 Review.
-
The promise of multi-omics and clinical data integration to identify and target personalized healthcare approaches in autism spectrum disorders.OMICS. 2015 Apr;19(4):197-208. doi: 10.1089/omi.2015.0020. OMICS. 2015. PMID: 25831060 Free PMC article. Review.
-
Comparative oncogenomics implicates the neurofibromin 1 gene (NF1) as a breast cancer driver.Genetics. 2012 Oct;192(2):385-96. doi: 10.1534/genetics.112.142802. Epub 2012 Jul 30. Genetics. 2012. PMID: 22851646 Free PMC article.
-
Tight junction proteins: from barrier to tumorigenesis.Cancer Lett. 2013 Aug 28;337(1):41-8. doi: 10.1016/j.canlet.2013.05.038. Epub 2013 Jun 3. Cancer Lett. 2013. PMID: 23743355 Free PMC article. Review.
References
-
- Perou CM, Sorlie T, Eisen MB, van de Rijn M, Jeffrey SS, Rees CA, Pollack JR, Ross DT, Johnsen H, Akslen LA, Fluge O, Pergamenschikov A, Williams C, Zhu SX, Lonning PE, Borresen-Dale A-L, Brown PO, Botstein D. Molecular portraits of human breast tumours. Nature. 2000;406:747–752. doi: 10.1038/35021093. - DOI - PubMed
-
- Sørlie T, Perou CM, Tibshirani R, Aas T, Geisler S, Johnsen H, Hastie T, Eisen MB, van de Rijn M, Jeffrey SS, Thorsen T, Quist H, Matese JC, Brown PO, Botstein D, Eystein Lønning P, Børresen-Dale AL. Gene expression patterns of breast carcinomas distinguish tumor subclasses with clinical implications. Proc Natl Acad Sci USA. 2001;98:10869–10874. doi: 10.1073/pnas.191367098. - DOI - PMC - PubMed
-
- Carey LA, Perou CM, Livasy CA, Dressler LG, Cowan D, Conway K, Karaca G, Troester MA, Tse CK, Edmiston S, Deming SL, Geradts J, Cheang MC, Nielsen TO, Moorman PG, Earp HS, Millikan RC. Race, breast cancer subtypes, and survival in the Carolina Breast Cancer Study. JAMA. 2006;295:2492–2502. doi: 10.1001/jama.295.21.2492. - DOI - PubMed
-
- Herschkowitz JI, Simin K, Weigman VJ, Mikaelian I, Usary J, Hu Z, Rasmussen KE, Jones LP, Assefnia S, Chandrasekharan S, Backlund MG, Yin Y, Khramtsov AI, Bastein R, Quackenbush J, Glazer RI, Brown PH, Green JE, Kopelovich L, Furth PA, Palazzo JP, Olopade OI, Bernard PS, Churchill GA, Van Dyke T, Perou CM. Identification of conserved gene expression features between murine mammary carcinoma models and human breast tumors. Genome Biol. 2007;8:R76. doi: 10.1186/gb-2007-8-5-r76. - DOI - PMC - PubMed
Publication types
MeSH terms
Substances
Grants and funding
LinkOut - more resources
Full Text Sources
Other Literature Sources
Medical
Molecular Biology Databases
Research Materials
Miscellaneous
