

STAT3 activation of miR-21 and miR-181b-1 via PTEN and CYLD are part of the epigenetic switch linking inflammation to cancer
- PMID: 20797623
- PMCID: PMC2929389
- DOI: 10.1016/j.molcel.2010.07.023
STAT3 activation of miR-21 and miR-181b-1 via PTEN and CYLD are part of the epigenetic switch linking inflammation to cancer
Abstract
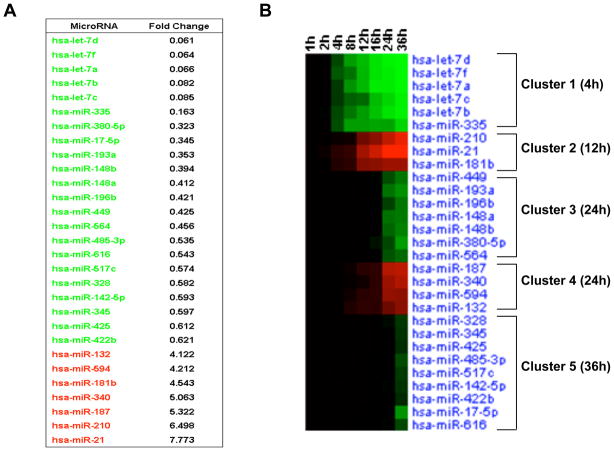
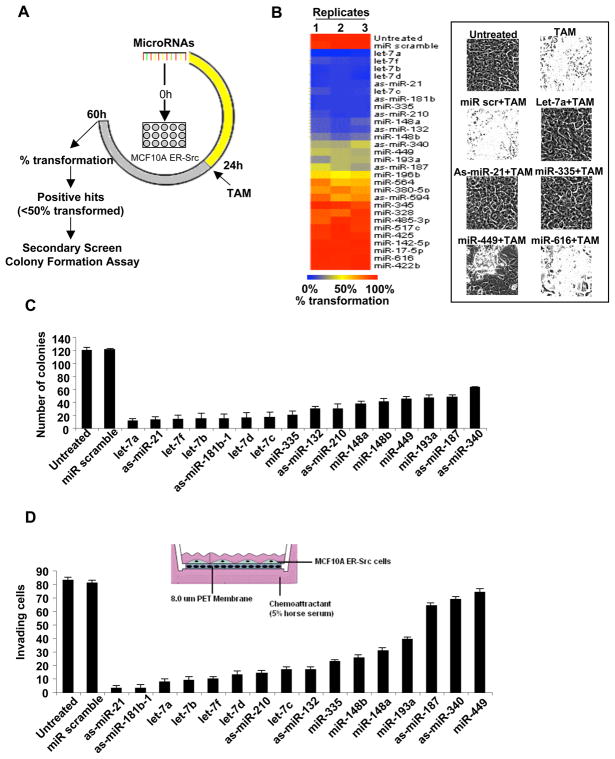
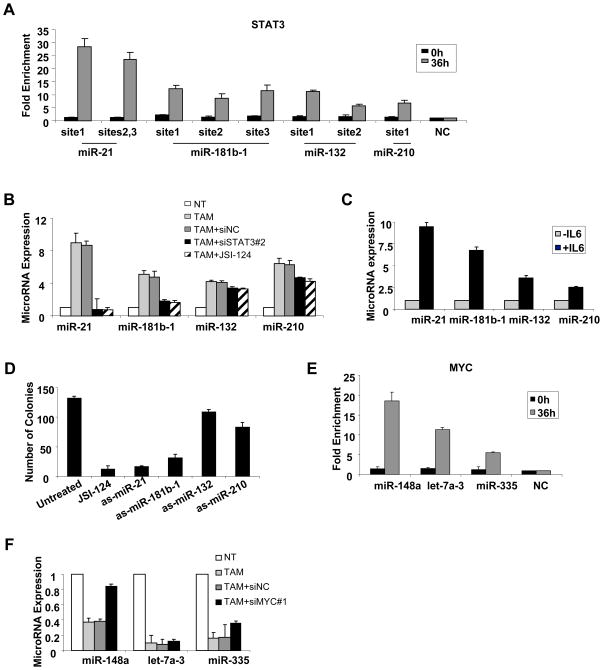
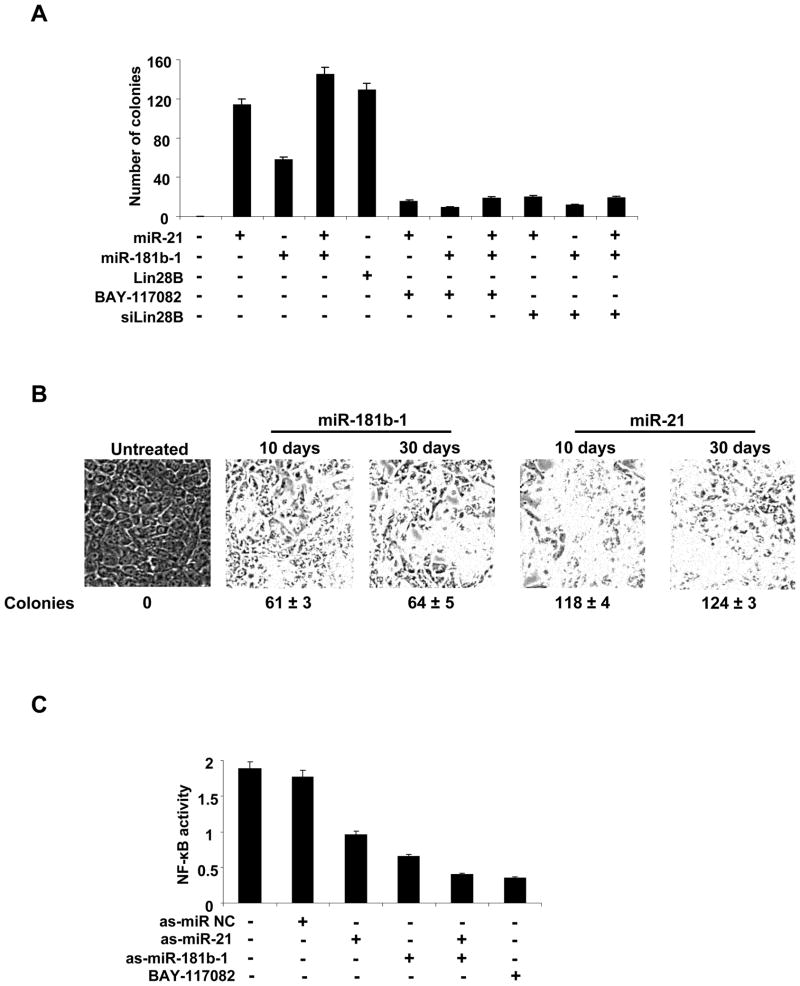
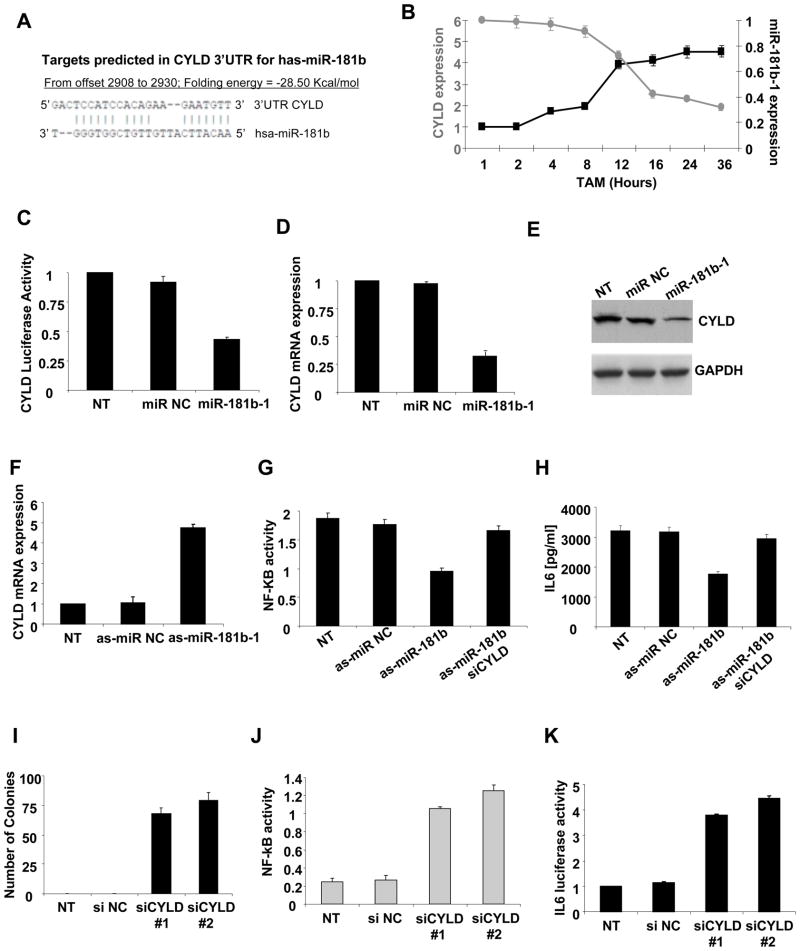
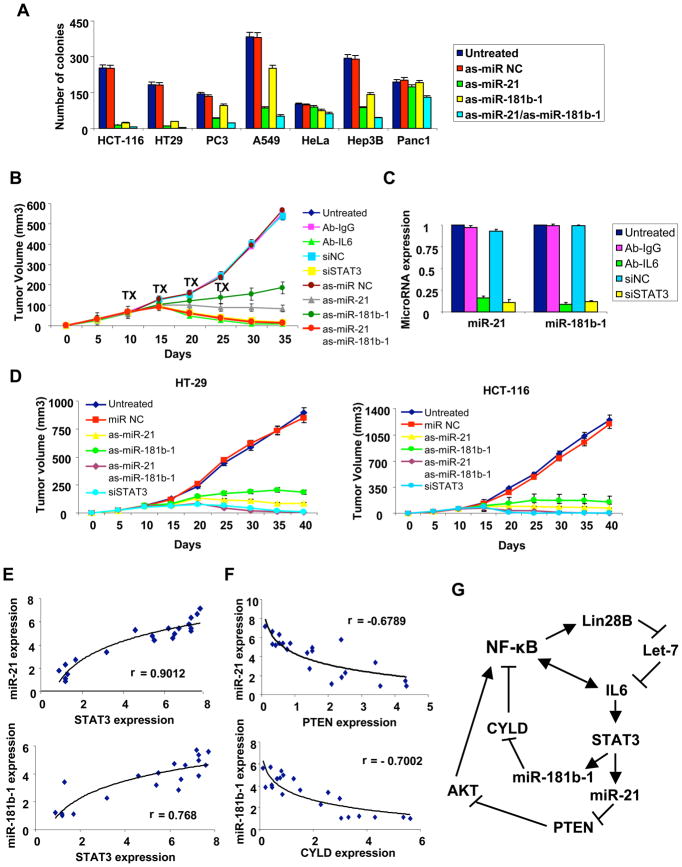
A transient inflammatory signal can initiate an epigenetic switch from nontransformed to cancer cells via a positive feedback loop involving NF-kappaB, Lin28, let-7, and IL-6. We identify differentially regulated microRNAs important for this switch and putative transcription factor binding sites in their promoters. STAT3, a transcription factor activated by IL-6, directly activates miR-21 and miR-181b-1. Remarkably, transient expression of either microRNA induces the epigenetic switch. MiR-21 and miR-181b-1, respectively, inhibit PTEN and CYLD tumor suppressors, leading to increased NF-kappaB activity required to maintain the transformed state. These STAT3-mediated regulatory circuits are required for the transformed state in diverse cell lines and tumor growth in xenografts, and their transcriptional signatures are observed in colon adenocarcinomas. Thus, STAT3 is not only a downstream target of IL-6 but, with miR-21, miR-181b-1, PTEN, and CYLD, is part of the positive feedback loop that underlies the epigenetic switch that links inflammation to cancer.
Copyright (c) 2010 Elsevier Inc. All rights reserved.
Figures

Comment in
-
Tumorigenesis: Dangerous micromanagement.Nat Rev Cancer. 2010 Oct;10(10):664. doi: 10.1038/nrc2939. Nat Rev Cancer. 2010. PMID: 21080565 No abstract available.
Similar articles
-
Reciprocal activation between STAT3 and miR-181b regulates the proliferation of esophageal cancer stem-like cells via the CYLD pathway.Mol Cancer. 2016 May 17;15(1):40. doi: 10.1186/s12943-016-0521-7. Mol Cancer. 2016. PMID: 27189061 Free PMC article.
-
A microRNA 221- and 222-mediated feedback loop maintains constitutive activation of NFκB and STAT3 in colorectal cancer cells.Gastroenterology. 2014 Oct;147(4):847-859.e11. doi: 10.1053/j.gastro.2014.06.006. Epub 2014 Jun 12. Gastroenterology. 2014. PMID: 24931456 Free PMC article.
-
A model for the epigenetic switch linking inflammation to cell transformation: deterministic and stochastic approaches.PLoS Comput Biol. 2014 Jan 30;10(1):e1003455. doi: 10.1371/journal.pcbi.1003455. eCollection 2014 Jan. PLoS Comput Biol. 2014. PMID: 24499937 Free PMC article.
-
NF-κB and STAT3 signaling pathways collaboratively link inflammation to cancer.Protein Cell. 2013 Mar;4(3):176-85. doi: 10.1007/s13238-013-2084-3. Epub 2013 Mar 13. Protein Cell. 2013. PMID: 23483479 Free PMC article. Review.
-
Apoptosis and the target genes of microRNA-21.Chin J Cancer. 2011 Jun;30(6):371-80. doi: 10.5732/cjc.011.10132. Chin J Cancer. 2011. PMID: 21627859 Free PMC article. Review.
Cited by
-
Progress risk assessment of oral premalignant lesions with saliva miRNA analysis.BMC Cancer. 2013 Mar 19;13:129. doi: 10.1186/1471-2407-13-129. BMC Cancer. 2013. PMID: 23510112 Free PMC article.
-
Prognostic role of microRNA-21 expression in gliomas: a meta-analysis.J Neurooncol. 2016 Oct;130(1):11-17. doi: 10.1007/s11060-016-2233-7. Epub 2016 Aug 16. J Neurooncol. 2016. PMID: 27531352 Review.
-
Interplay of microRNAs, transcription factors and target genes: linking dynamic expression changes to function.Nucleic Acids Res. 2013 Mar 1;41(5):2817-31. doi: 10.1093/nar/gks1471. Epub 2013 Jan 17. Nucleic Acids Res. 2013. PMID: 23335783 Free PMC article.
-
Transcriptomic and CRISPR/Cas9 technologies reveal FOXA2 as a tumor suppressor gene in pancreatic cancer.Am J Physiol Gastrointest Liver Physiol. 2016 Jun 1;310(11):G1124-37. doi: 10.1152/ajpgi.00035.2016. Epub 2016 May 5. Am J Physiol Gastrointest Liver Physiol. 2016. PMID: 27151939 Free PMC article.
-
Regulation of breast cancer metastasis signaling by miRNAs.Cancer Metastasis Rev. 2020 Sep;39(3):837-886. doi: 10.1007/s10555-020-09905-7. Cancer Metastasis Rev. 2020. PMID: 32577859 Free PMC article. Review.
References
Publication types
MeSH terms
Substances
Grants and funding
LinkOut - more resources
Full Text Sources
Other Literature Sources
Medical
Research Materials
Miscellaneous
