. 2010 Jul 22;6(7):e1001012.
doi: 10.1371/journal.ppat.1001012.

Virus-infection or 5'ppp-RNA activates antiviral signal through redistribution of IPS-1 mediated by MFN1

Affiliations

Virus-infection or 5'ppp-RNA activates antiviral signal through redistribution of IPS-1 mediated by MFN1

Kazuhide Onoguchi et al. PLoS Pathog. .

Abstract

In virus-infected cells, RIG-I-like receptor (RLR) recognizes cytoplasmic viral RNA and triggers innate immune responses including production of type I and III interferon (IFN) and the subsequent expression of IFN-inducible genes. Interferon-beta promoter stimulator 1 (IPS-1, also known as MAVS, VISA and Cardif) is a downstream molecule of RLR and is expressed on the outer membrane of mitochondria. While it is known that the location of IPS-1 is essential to its function, its underlying mechanism is unknown. Our aim in this study was to delineate the function of mitochondria so as to identify more precisely its role in innate immunity. In doing so we discovered that viral infection as well as transfection with 5'ppp-RNA resulted in the redistribution of IPS-1 to form speckle-like aggregates in cells. We further found that Mitofusin 1 (MFN1), a key regulator of mitochondrial fusion and a protein associated with IPS-1 on the outer membrane of mitochondria, positively regulates RLR-mediated innate antiviral responses. Conversely, specific knockdown of MFN1 abrogates both the virus-induced redistribution of IPS-1 and IFN production. Our study suggests that mitochondria participate in the segregation of IPS-1 through their fusion processes.


Conflict of interest statement

The authors have declared that no competing interests exist.

Figures
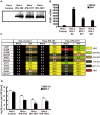
Figure 1
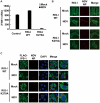
Figure 1. Stable HeLa cell clones expressing FLAG tagged IPS-1.
A, Expression of FLAG-IPS-1 was examined in control and IPS-1-expressing HeLa clones (#2, 17, and 21) by immunoblotting using anti-FLAG antibody. B, Expression of IFNB1 in control and IPS-1-HeLa cells was examined by quantitative real time PCR (qRT-PCR). Open and filled bars indicate mock-treated and SeV-infected cells for 12 h, respectively. Data represent means ± s.d. (n = 3). C, Expression profiles of cytokine and chemokine genes in control and IPS-1-HeLa cells. Total RNA extracted from indicated cells mock-treated or SeV-infected for 12 h was subjected to analysis using a DNA microarray. Relative mRNA levels using a control expression of 1.0 are shown. D, Replication of EMCV in control and IPS-1-HeLa clones. The indicated cell clones were infected with EMCV at a MOI of 1 or 10. The viral titer in the culture medium at 24 h post-infection was determined with the plaque assay. Data represent means ± s.d. (n = 3).
Figure 2
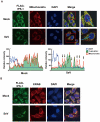
Figure 2. Redistribution of IPS-1 in SeV-infected cells.
A, The IPS-1-HeLa clone #2 was mock-treated or infected with SeV for 12 h and stained with MitoTracker (Mitochondria) and anti-FLAG antibody (FLAG-IPS-1). Nuclei were visualized by staining with DAPI throughout this study. The fluorescent image was quantified in the area indicated by blue line (right most panel). Quantification results from mock- or SeV-infected cells are shown at the bottom. Fluorescence of DAPI corresponds to area in the nucleus. The mitochondria heavily stained with MitoTracker but lightly stained with anti-FLAG are shown by arrows. B, IPS-1-HeLa cells were mock-treated or infected with SeV for 12 h. Cells were stained with anti-FLAG antibody (FLAG-IPS-1) and anti-ERAB antibody (ERAB).
Figure 3
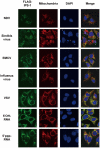
Figure 3. Redistribution of IPS-1 induced by virus-infection and 5′ppp-RNA-transfection.
IPS-1-HeLa cells were infected with the indicated viruses or transfected with 5′OH-RNA or 5′ppp-RNA chemically synthesized by in vitro transcription using T7 RNA polymerase. At 12 h post-infection or -transfection, the cells were stained with anti-FLAG antibody and MitoTracker (Mitochondria). Arrowheads show dead cells with shrunk nuclei in Sindbis virus-infected cells.
Figure 4
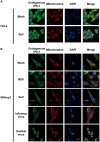
Figure 4. Redistribution of endogenous IPS-1 in virus-infected cells.
A, HeLa cells were infected with Mock or SeV for 12 h. The cells were stained with anti-IPS-1 antibody and MitoTracker (Mitochondria). B, SKHep1 cells were infected with NDV, SeV, Influenza virus, or Sindbis virus for 12 h. The cells were stained with anti-IPS-1 antibody and MitoTracker (Mitochondria).
Figure 5
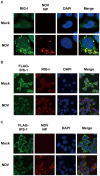
Figure 5. Localization of viral nucleocapsid, RIG-I, and IPS-1.
A, HeLa cells were infected with NDV for 12 h and stained with anti-RIG-I antibody (RIG-I) and anti-NP antibody (NDV NP). B and C, IPS-1-HeLa cells were infected with NDV for 12 h and stained with anti-FLAG antibody and anti-RIG-I antibody or anti-NP antibody.
Figure 6
Figure 6. Localization of IPS-1 and mitochondria.
A, IPS-1-HeLa cells infected with NDV for 9 h were fixed, stained with anti-NP antibody, and subjected to ultrathin sectioning as shown in the Methods. The area enclosed by a red rectangle is enlarged. NP: NP foci stained with the anti-NP antibody were visualized using gold particles. B, IPS-1-HeLa cells infected with NDV for 9 h were fixed, stained with anti-FLAG antibody, and subjected to ultra thin sectioning. The area enclosed by a red rectangle is enlarged. NP: morphologically similar structures are in A. IPS-1 was visualized using gold particles. The arrowheads indicate boundaries between IPS-1 and NP foci.
Figure 7
Figure 7. A dominant negative mutant of RIG-I fails to induce IPS-1 redistribution.
A, IPS-1-HeLa cells stably expressing wild-type human RIG-I (RIG-I WT) or mutant RIG-I (RIG-I K270A) were mock-treated or infected with NDV for 12 h and expression of IFNB1 mRNA was analyzed by qRT-PCR. Open and filled bars indicate RNA samples from mock-treated and NDV-infected cells, respectively. Data represent means ± s.d. (n = 3). B, IPS-1-HeLa cells expressing RIG-I WT or RIG-I K270A were infected with NDV for 12 h and stained with anti-RIG-I antibody and anti-NP antibody. RIG-I staining is diffuse in uninfected cells however infection by NDV produced RIG-I foci. Some RIG-I foci are co-localized with NDV NP foci. C, IPS-1-HeLa cells expressing RIG-I WT or RIG-I K270A were infected with NDV for 12 h and IPS-1 redistribution was examined. IPS-1 and NP were stained with anti-IPS-1 antibody and anti-NP antibody, respectively. The area enclosed by the red rectangle is enlarged at the right. Although the redistributed IPS-1 surrounds NP foci in RIG-I WT cells, K270A mutation of RIG-I failed to induce the redistribution of IPS-1, but not the formation of NP foci.
Figure 8
Figure 8. MFN1 is involved in antiviral signaling.
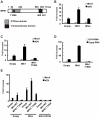
A, Schematic representation of the MFN1 domain. B, L929 cells were transfected with a virus-responsive reporter gene (p-125 Luc) and either an empty vector (Empty), an expression vector for MFN1, or an expression vector for MFN2 as indicated. 48 h after the transfection, cells were mock-treated or infected with NDV. Luciferase activity was determined at 12 h after infection. C and D, L929 cells were transfected with a virus-responsive reporter gene (p-125 Luc) and either an empty vector (Empty) or an expression vector for MFN1 or its mutant (MFN1 T109A) as indicated. At 48 h after transfection, cells were mock-treated, infected with NDV, or transfected with 5′OH-RNA or 5′ppp-RNA. Luciferase activity was determined at 12 h (C) or 9 h (D) after induction. E, L929 cells were transfected with a virus-responsive reporter gene (p-125 Luc) and combinations of the indicated vectors. 48 h after the transfection, cells were mock-treated or infected with NDV. Luciferase activity was determined 12 h after infection.
Figure 9
Figure 9. MFN1 plays a critical role in RIG-I–induced signaling.
A and B, Wild-type (WT) MEFs and Mfn1 or Mfn2-knockout MEFs were infected with NDV for 9 h. The levels of endogenous Ifna4 (A) and Ifnb1 (B) mRNA were quantified by qRT-PCR. C, HeLa cells were transfected with negative control (N.C.) or hOPA1-targeted siRNA (#1–#3) for 72 h, and the expression of OPA1 mRNA was analyzed by qRT-PCR. D, HeLa cells were transfected with N.C. siRNA or hOPA1-targeted siRNA. 72 h after transfection, cells were infected with NDV for 12 h. IFNB1 mRNA expression was quantified by qRT-PCR. E, HeLa cells were transfected with N.C. siRNA or hDRP1-targeted siRNA (#1–#3) for 72 h, and the knockdown of endogenous DRP1 was analyzed by Western blotting using anti-DRP1 antibody. F, HeLa cells were transfected with N.C. siRNA or hDRP1-targeted siRNA. At 72 h after transfection, cells were infected with NDV for 12 h. IFNB1 mRNA expression was quantified by qRT-PCR. G, WT and Mfn1 or Mfn2-knockout MEFs were transfected with a virus-responsive reporter gene (p-125 Luc) with either an empty vector (Empty) or an expression vector for RIG-I CARD or IPS-1. Luciferase activity was determined 48 h after transfection. Data represent means ± s.d. (n = 3).
Figure 10
Figure 10. IPS-1 interacts with MFN1 and MFN2.
IPS-1-HeLa cells were infected with NDV for 12 h, and then FLAG-IPS-1 was immunoprecipitated with anti-FLAG antibody. Co-immunoprecipitated MFN1 and MFN2 were detected by anti-MFN1 antibody and anti-MFN2 antibody, respectively. Neither OPA1 nor DRP1 was co-immunoprecipitated with FLAG-IPS-1. Mitochondrial protein BCL-Xl was used as a control and was also examined by anti-BCLXl antibody.
Figure 11
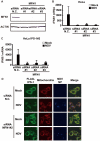
Figure 11. Knockdown of MFN1 inhibits the redistribution of IPS-1 induced by NDV infection.
A, HeLa cells were transfected with negative control (N.C.) or hMFN1-targeted siRNA (#1–#3) for 48 h, and the knockdown of endogenous MFN1 was analyzed by Western blotting using anti-MFN1 antibody. B, Cells transfected with siRNA as shown in a were infected with NDV for 12 h, and endogenous IFNB1 mRNA expression was quantified by qRT-PCR. Data represent means ± s.d. (n = 3). C, IPS-1-HeLa cells transfected with N.C. or hMFN1-targeted siRNA were infected with NDV for 12 h, and endogenous IFNB1 mRNA expression was quantified by qRT-PCR. Data represent means ± s.d. (n = 3). D, IPS-1-HeLa cells transfected with N.C. or hMFN1-targeted siRNA#2 for 48 h. Cells were infected with NDV for 12 h and stained with anti-FLAG antibody (FLAG-IPS-1), anti-NP antibody (NDV NP), and MitoTracker (Mitochondria).
Figure 12
Figure 12. Knockdown of MFN1 inhibits the redistribution of IPS-1 induced by SeV infection.
IPS-1-HeLa cells transfected with negative control (N.C.) or hMFN1-targeted siRNA#2 for 48 h. Cells were infected with SeV for 12 h and stained with anti-FLAG antibody (FLAG-IPS-1), MitoTracker (Mitochondria), and DAPI. The area enclosed by the red rectangle is enlarged at the right.
Figure 13
Figure 13. Model for the redistribution of IPS-1 mediated by mitochondrial organization.
A, Schematic representation of the redistribution of IPS-1 induced by viral infection. In uninfected cells, IPS-1 is evenly distributed in all mitochondria (left). In infected cells, foci of viral nucleoprotein form, which are surrounded by redistributed IPS-1 and mitochondria (right). B, A model for the redistribution of IPS-1 mediated by mitochondrial organization. Initially, IPS-1 is distributed evenly in mitochondria (left). Viruses replicate in restricted compartments in the cells, viral RNA accumulates, and then RIG-I re-localizes to these compartments. Viral RNA induces a conformational change of RIG-I, and results in mitochondria expressing accumulated IPS-1- around the RIG-I foci. IPS-1 may be redistributed, resulting in a local accumulation of IPS-1 on a mitochondrion (left). IPS-I may further segregate due to mitochondrial reorganization by fusion and fission (right). Local accumulation of IPS-1 may further recruit adaptors and protein kinases to activate antiviral signaling.

Similar articles

Cited by

References

    1. Samuel CE. Antiviral actions of interferons. Clin Microbiol Rev. 2001;14:778–809, table of contents. - PMC - PubMed
    1. Theofilopoulos AN, Baccala R, Beutler B, Kono DH. Type I interferons (alpha/beta) in immunity and autoimmunity. Annu Rev Immunol. 2005;23:307–336. - PubMed
    1. Kotenko SV, Gallagher G, Baurin VV, Lewis-Antes A, Shen M, et al. IFN-lambdas mediate antiviral protection through a distinct class II cytokine receptor complex. Nat Immunol. 2003;4:69–77. - PubMed
    1. Sheppard P, Kindsvogel W, Xu W, Henderson K, Schlutsmeyer S, et al. IL-28, IL-29 and their class II cytokine receptor IL-28R. Nat Immunol. 2003;4:63–68. - PubMed
    1. Yoneyama M, Fujita T. RNA recognition and signal transduction by RIG-I-like receptors. Immunol Rev. 2009;227:54–65. - PubMed

Publication types