Interleukin-33 induces protective effects in adipose tissue inflammation during obesity in mice
- PMID: 20634488
- PMCID: PMC4254700
- DOI: 10.1161/CIRCRESAHA.110.218867
Interleukin-33 induces protective effects in adipose tissue inflammation during obesity in mice
Abstract
Rationale: Chronic low-grade inflammation involving adipose tissue likely contributes to the metabolic consequences of obesity. The cytokine interleukin (IL)-33 and its receptor ST2 are expressed in adipose tissue, but their role in adipose tissue inflammation during obesity is unclear.
Objective: To examine the functional role of IL-33 in adipose tissues and investigate the effects on adipose tissue inflammation and obesity in vivo.
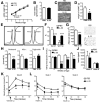
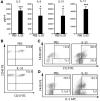
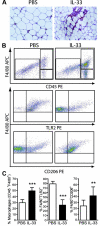
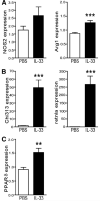
Methods and results: We demonstrate that treatment of adipose tissue cultures in vitro with IL-33 induced production of Th2 cytokines (IL-5, IL-13, IL-10) and reduced expression of adipogenic and metabolic genes. Administration of recombinant IL-33 to genetically obese diabetic (ob/ob) mice led to reduced adiposity, reduced fasting glucose and improved glucose and insulin tolerance. IL-33 also induced accumulation of Th2 cells in adipose tissue and polarization of adipose tissue macrophages toward an M2 alternatively activated phenotype (CD206(+)), a lineage associated with protection against obesity-related metabolic events. Furthermore, mice lacking endogenous ST2 fed high-fat diet had increased body weight and fat mass and impaired insulin secretion and glucose regulation compared to WT controls fed high-fat diet.
Conclusions: In conclusion, IL-33 may play a protective role in the development of adipose tissue inflammation during obesity.
Figures


Similar articles
-
Gab2 deficiency suppresses high-fat diet-induced obesity by reducing adipose tissue inflammation and increasing brown adipose function in mice.Cell Death Dis. 2021 Feb 26;12(2):212. doi: 10.1038/s41419-021-03519-9. Cell Death Dis. 2021. PMID: 33637697 Free PMC article.
-
Severe obesity increases adipose tissue expression of interleukin-33 and its receptor ST2, both predominantly detectable in endothelial cells of human adipose tissue.Int J Obes (Lond). 2013 May;37(5):658-65. doi: 10.1038/ijo.2012.118. Epub 2012 Jul 17. Int J Obes (Lond). 2013. PMID: 22828942
-
Deficiency in AIM2 induces inflammation and adipogenesis in white adipose tissue leading to obesity and insulin resistance.Diabetologia. 2019 Dec;62(12):2325-2339. doi: 10.1007/s00125-019-04983-x. Epub 2019 Sep 11. Diabetologia. 2019. PMID: 31511929 Free PMC article.
-
Adipocyte Oncostatin Receptor Regulates Adipose Tissue Homeostasis and Inflammation.Front Immunol. 2021 Mar 29;11:612013. doi: 10.3389/fimmu.2020.612013. eCollection 2020. Front Immunol. 2021. PMID: 33854494 Free PMC article. Review.
-
Changes in adipose tissue macrophages and T cells during aging.Crit Rev Immunol. 2014;34(1):1-14. doi: 10.1615/critrevimmunol.2013006833. Crit Rev Immunol. 2014. PMID: 24579699 Free PMC article. Review.
Cited by
-
Group 2 innate lymphoid cells promote beiging of white adipose tissue and limit obesity.Nature. 2015 Mar 12;519(7542):242-6. doi: 10.1038/nature14115. Epub 2014 Dec 22. Nature. 2015. PMID: 25533952 Free PMC article.
-
Graft IL-33 regulates infiltrating macrophages to protect against chronic rejection.J Clin Invest. 2020 Oct 1;130(10):5397-5412. doi: 10.1172/JCI133008. J Clin Invest. 2020. PMID: 32644975 Free PMC article.
-
Sterile inflammation - do innate lymphoid cell subsets play a role?Front Immunol. 2012 Aug 7;3:246. doi: 10.3389/fimmu.2012.00246. eCollection 2012. Front Immunol. 2012. PMID: 22891068 Free PMC article.
-
Specialized immune responses in the peritoneal cavity and omentum.J Leukoc Biol. 2021 Apr;109(4):717-729. doi: 10.1002/JLB.5MIR0720-271RR. Epub 2020 Sep 2. J Leukoc Biol. 2021. PMID: 32881077 Free PMC article. Review.
-
IL-33 Enhances Humoral Immunity Against Chronic HBV Infection Through Activating CD4(+)CXCR5(+) TFH Cells.J Interferon Cytokine Res. 2015 Jun;35(6):454-63. doi: 10.1089/jir.2013.0122. Epub 2015 Feb 25. J Interferon Cytokine Res. 2015. PMID: 25714983 Free PMC article.
References
-
- Hotamisligil GS. Inflammation and metabolic disorders. Nature. 2006;444:860–867. - PubMed
-
- Wu H, Ghosh S, Perrard XD, Feng L, Garcia GE, Perrard JL, Sweeney JF, Peterson LE, Chan L, Smith CW, Ballantyne CM. T-cell accumulation and regulated on activation, normal T cell expressed and secreted upregulation in adipose tissue in obesity. Circulation. 2007;115:1029–1038. - PubMed
-
- Kintscher U, Hartge M, Hess K, Foryst-Ludwig A, Clemenz M, Wabitsch M, Fischer-Posovszky P, Barth TF, Dragun D, Skurk T, Hauner H, Bluher M, Unger T, Wolf AM, Knippschild U, Hombach V, Marx N. T-lymphocyte infiltration in visceral adipose tissue: a primary event in adipose tissue inflammation and the development of obesity-mediated insulin resistance. Arterioscler Thromb Vasc Biol. 2008;28:1304–1310. - PubMed
-
- Lago F, Dieguez C, Gomez-Reino J, Gualillo O. Adipokines as emerging mediators of immune response and inflammation. Nat Clin Pract Rheumatol. 2007;3:716–724. - PubMed
Publication types
MeSH terms
Substances
Grants and funding
LinkOut - more resources
Full Text Sources
Other Literature Sources
Medical
Molecular Biology Databases
Miscellaneous

