. 2010 Jul 16;285(29):22036-49.
doi: 10.1074/jbc.M110.108878. Epub 2010 May 12.

Activation and repression of cellular immediate early genes by serum response factor cofactors

Affiliations

Activation and repression of cellular immediate early genes by serum response factor cofactors

Seung-Min Lee et al. J Biol Chem. .

Abstract

The induction of expression of many cellular immediate early genes (IEG) involves the transcription factor serum response factor (SRF). Two families of SRF coactivators have also been implicated in IEG induction, the ternary complex factors (TCFs), ELK1, Sap1, and Net, and the myocardin-related factors, MKL1 and MKL2. We found that serum induction of some SRF target genes is preferentially regulated by MKL1/2, whereas others are redundantly activated by both TCFs and MKL1/2. Yet ELK1 can also repress transcription. Binding of ELK1 and MKL1 to SRF has been found to be mutually exclusive in vitro, suggesting that ELK1 could repress expression of IEGs by blocking MKL1 binding. We characterized the in vivo binding of MKL1 and ELK1 to target genes and found an inverse relationship of serum-induced MKL1 binding and serum-decreased ELK1 binding. However, experiments with short hairpin RNA-mediated MKL1/2 depletion and expression of a nuclear MKL1 (N100) variant in stably transfected cells failed to alter ELK1 binding, suggesting that ELK1 binding to target genes is regulated independently of MKL1/2. Nevertheless, we found that short interfering RNA-mediated depletion of TCFs increased target gene expression in cells containing the N100 MKL1 activator, most notably in cells under continuous growth conditions. These results indicate that the TCFs can function both as activators and repressors of target gene expression depending upon the cellular growth conditions.


Figures

FIGURE 1.
FIGURE 1.
Utilization of MKL and TCF cofactors for serum induction of immediate early genes. A, MKL1 and MKL2 levels in TO3T3 cells stably expressing either control shRNA or shRNA targeting MKL1 and MKL2 were measured by immunoblotting with anti-MKL1 and -MKL2 antibodies. Hsp90 levels detected with anti-Hsp90 antibodies served as a loading control. B, ELK1 levels in TRE cells transfected with TCF siRNAs or control siRNAs were measured by immunoblotting with anti-ELK1. Actin levels were detected with anti-actin antibodies as a loading control. The levels of MKL1/2 and ELK1 proteins in the si/shRNA lanes compared with control lanes are indicated to the right of the immunoblots. C, nontarget and MKL1/2 knockdown (KD) cells were transfected with either control siRNA or siRNA targeting the TCF family, ELK1, Sap1, and Net. The next day, the cells were starved in media supplemented with 0.2% FBS overnight and stimulated for the indicated times with media containing 20% FBS. Total RNA was isolated from cells, and the levels of the indicated genes were analyzed by quantitative real time RT-PCR. 18 S rRNA levels were measured to normalize the RNA amount. Means of three experiments are shown with standard deviations.
FIGURE 2.
FIGURE 2.
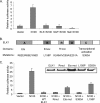
Nuclear MKL1 does not affect IEG expression. A, endogenous MKL1 levels in TRE (TO3T3 cell containing an empty pRevTRE vector) and N100 cells (TO3T3 cells containing pRevN100) were assessed by immunoblotting using anti-MKL1 antibodies. B, cellular localization of MKL1 in TRE and N100 cells was detected by immunofluorescence with anti-MKL1 or anti-FLAG antibodies. Cells were either serum-starved or stimulated for 5 min and analyzed as described under “Experimental Procedures.” C, TRE and N100 cells were serum-starved in media containing 0.2% FBS overnight and then stimulated with 20% FBS for the indicated times. TRE and N100 cells continuously grown in media containing 10% FBS are indicated as nonstarved (NS). Endogenous expression levels of c-fos, Egr2, Vcl, and SRF were assessed by quantitative real time RT-PCR. Means of three experiments are shown with standard deviations.
FIGURE 3.
FIGURE 3.
Repression of MKL1 activation by ELK1. A, TRE cells were transfected with pFosWTGL3 reporter containing the SRE region of the mouse c-fos promoter (79), pRevN100 expressing the MKL1 N100 deletion mutant, and each TCF family expression plasmid. As an internal control pRLSV40P, with the SV40 promoter driving Renilla luciferase gene, was also transfected. Cells were harvested 48 h after transfection, and Firefly and Renilla luciferase activities were measured. Firefly luciferase levels were normalized to Renilla levels to control for transfection efficiencies. Results were then normalized as fold activation relative to the level measured in TRE cells transfected with empty vectors. Data are the mean value from three experiments with error bars showing the standard deviations. B, schematic diagram of the ELK1 protein domains and mutations. The mutations in ELK1 are indicated below each domain. C, cells were transfected as in A with the indicated ELK1 mutants. Inset, the expression of wild type and each ELK1 mutant was detected by immunoblotting with anti-hemagglutinin antibodies.
FIGURE 4.
FIGURE 4.
Binding of MKL1 and ELK1 to target promoters. A, TRE cells were serum-starved for 24 h in DMEM containing 0.2% FBS and then stimulated with 20% FBS for 5 min. Chromatin immunoprecipitation was performed with anti-MKL1 or anti-ELK1 antibodies and the indicated gene probes by qPCR. Vcl-2292, probe for upstream region of the Vcl gene used as a control. To obtain the relative DNA binding values, the amount of signal for each gene in immunoprecipitated DNA was divided by the amount in input DNA. B, levels of MKL1 and ELK1 binding to starved and nonstarved TRE cells were determined as in A. Nonstarved TRE cells were continuously grown in DMEM containing 10% FBS. C, immunoblot of TRE cells with anti-ELK1 antibodies. Cells were serum-starved (0.2%) or induced with phorbol 12-myristate 13-acetate (PMA; 100 ng/ml), serum (20%) as above, pretreated with the MEK1/2 inhibitor PD0325901 (PD, 5 μm) for 30 min, and serum-stimulated for 5 min (PD/20%), or grown continually in media containing serum (10%). D, chromatin immunoprecipitation for binding of ELK1 to the SRF promoter in TRE cells treated as in C was performed with anti-ELK1 antibodies as in A.
FIGURE 5.
FIGURE 5.
Effect of MKL1/2 depletion on MKL1 and ELK1 binding to target promoters. Control (nontarget) and MKL1/2KD cells were analyzed for MKL1 and ELK1 binding to the indicated target gene promoters by ChIP. The cells were serum-starved overnight and then stimulated for 5 min. ChIP analysis of MKL1 and ELK1 was as described for Fig. 4.
FIGURE 6.
FIGURE 6.
Effect of nuclear MKL1 on ELK1 binding to target promoters. A, vector expressing MKL1 N100 (pN100) or control vector (pTRE) was transfected into TRE cells, and 48 h after transfection, ELK1 binding to target promoters was determined by chromatin immunoprecipitation as in Fig. 4. B, DNA binding of N100 to target promoters in stably transfected N100 and TRE cells was analyzed by ChIP using antibodies to the FLAG epitope tag on N100. Primers for the Vcl promoter and for a control region 2292 bp upstream of the Vcl gene transcriptional initiation site were used. C and D, relative in vivo binding of MKL1 (C) and ELK1 (D) in TRE and N100 cell lines was detected by ChIP as in Fig. 4. Cells were serum-starved or stimulated for 5 min as indicated.
FIGURE 7.
FIGURE 7.
Suppression of TCFs increases IEG expression in serum-starved N100 cells. TRE and N100 cells were transiently transfected with siRNAs targeting the TCF family members or control siRNAs as in Fig. 1B. One day after transfection, the cells were serum-starved overnight followed by serum stimulation for 0.5, 1, or 3 h. Levels of the IEG mRNAs were determined by qPCR as in Fig. 1. The means were calculated from three independent experiments. *, p = 0.05 to 0.01; **, p < 0.01 for values compared with control TRE siCtrl levels.
FIGURE 8.
FIGURE 8.
siRNA-mediated depletion of TCFs increases expression of c-fos and Egr2 in N100 cells under continuous growth conditions. TRE and N100 cells grown in media containing 10% FBS were transfected with control siRNA and TCF siRNAs for 48 h. Levels of c-fos, Egr2, Vcl, and Srf mRNAs were analyzed by qPCR as in Fig. 1.
FIGURE 9.
FIGURE 9.
siRNA-mediated depletion of possible TCF corepressive factors. TRE and N100 cells grown in media containing 10% FBS were transfected with control siRNA and the indicated siRNAs for 48 h. A, levels of c-fos and Egr2 mRNAs were analyzed by qPCR as in Fig. 1. B, relative mRNA levels of the indicated siRNA target genes were determined by qPCR.
FIGURE 10.
FIGURE 10.
Model for TCF and MKL regulation of immediate early gene expression. A model for regulation of c-fos and Egr2 expression is shown in serum-starved, serum-stimulated cells or nonstarved cells. The curved lines with perpendicular lines at the ends indicate transcriptional repression, and those with arrowheads indicate transcriptional activation. See text for details.

Similar articles

Cited by

References

    1. Almendral J. M., Sommer D., Macdonald-Bravo H., Burckhardt J., Perera J., Bravo R. (1988) Mol. Cell. Biol. 8, 2140–2148 - PMC - PubMed
    1. Cochran B. H., Zullo J., Verma I. M., Stiles C. D. (1984) Science 226, 1080–1082 - PubMed
    1. Müller R., Bravo R., Burckhardt J., Curran T. (1984) Nature 312, 716–720 - PubMed
    1. Greenberg M. E., Ziff E. B. (1984) Nature 311, 433–438 - PubMed
    1. Bravo R. (1990) Cell Growth Differ. 1, 305–309 - PubMed

Publication types

MeSH terms