. 2010 May 10;207(5):1045-56.
doi: 10.1084/jem.20100050. Epub 2010 Apr 12.

The NLRP3 inflammasome functions as a negative regulator of tumorigenesis during colitis-associated cancer

Affiliations

The NLRP3 inflammasome functions as a negative regulator of tumorigenesis during colitis-associated cancer

Irving C Allen et al. J Exp Med. .

Abstract

Colitis-associated cancer (CAC) is a major complication of inflammatory bowel diseases. We show that components of the inflammasome are protective during acute and recurring colitis and CAC in the dextran sulfate sodium (DSS) and azoxymethane + DSS models. Mice lacking the inflammasome adaptor protein PYCARD (ASC) and caspase-1 demonstrate increased disease outcome, morbidity, histopathology, and polyp formation. The increased tumor burden is correlated with attenuated levels of IL-1beta and IL-18 at the tumor site. To decipher the nucleotide-binding domain, leucine-rich-repeat-containing (NLR) component that is involved in colitis and CAC, we assessed Nlrp3 and Nlrc4 deficient mice. Nlrp3(-/-) mice showed an increase in acute and recurring colitis and CAC, although the disease outcome was less severe in Nlrp3(-/-) mice than in Pycard(-/-) or Casp1(-/-) animals. No significant differences were observed in disease progression or outcome in Nlrc4(-/-) mice compared with similarly treated wild-type animals. Bone marrow reconstitution experiments show that Nlrp3 gene expression and function in hematopoietic cells, rather than intestinal epithelial cells or stromal cells, is responsible for protection against increased tumorigenesis. These data suggest that the inflammasome functions as an attenuator of colitis and CAC.


Figures

Figure 1.
Figure 1.
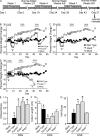
NLR inflammasome components attenuate acute ulcerative colitis. (A) Schematic of the acute model of DSS-induced ulcerative colitis. (B) Kaplan-Meier plot of WT, Nlrp3−/−, Pycard−/−, and Casp1−/− mouse survival. (C) Weight loss of WT, Nlrp3−/−, and Pycard−/− mice. (D) Clinical parameters (weight loss, stool consistency, bleeding) of indicated mice. Data shown are representative of at least three independent experiments and depict the mean ± SEM. The symbols # and § indicate P < 0.05 and P < 0.01, respectively, between the mock- and DSS-treated WT; * indicates P < 0.05 between the DSS-treated gene-deficient strains compared with DSS-treated WT. WT mock, n = 4; DSS-treated WT, n = 14; Pycard−/−, n = 4; Nlrp3−/−, n = 6; Casp1−/−, n = 4. Casp1−/− animals were highly sensitive to the acute administration of DSS and were not subjected to additional monitoring described in C and D for humane reasons.
Figure 2.
Figure 2.
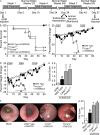
NLR inflammasome components attenuate recurring ulcerative colitis. (A) Schematic of the recurring model of DSS-induced ulcerative colitis. (B–D) Weight loss of Pycard−/−, Nlrp3−/−, and Casp1−/− mice after DSS challenge. (E) Clinical parameters (weight loss, stool consistency, and bleeding) of indicated mice. These data are the averages of each clinical score collected throughout the recurring colitis model. (F) Colon length of indicated mice. (G) Colon histopathology scores reflecting the severity of inflammation, epithelial defects, crypt atrophy, and area affected in hematoxylin and eosin–stained sections through the mid and distal colon. The individual scores are shown in Fig. S2 and summed to generate a HAI. Colon length and histopathology were assessed in the Casp1−/− animals on day 40, whereas these two parameters were assessed on day 57 in the other genotypes tested. Data shown are representative of three independent experiments and depict the mean ± SEM. Error bars have been omitted from the weight loss data for clarity of presentation. The symbols # and § indicate P < 0.05 and P < 0.01, respectively, between the mock- and DSS-treated WT; * indicates P < 0.05 between the DSS-treated gene-deficient strains and WT. WT mock, n = 5; WT, n = 5; Pycard−/−, n = 3; Casp1−/−, n = 4; Nlrp3−/−, n = 3.
Figure 3.
Figure 3.
Casp1−/− and Pycard−/− mice are highly susceptible to inflammation-driven colon tumorigenesis. (A) Schematic of the four stage model of inflammation-driven tumor progression using the chemical carcinogen AOM and DSS. (B) Kaplan-Meier plot of WT, Casp1−/−, and Pycard−/− mouse survival. (C and D) Weight loss after AOM+DSS challenge. (E) Clinical parameters associated with increased gastrointestinal disease. (F) Inflammation and tumors revealed by in vivo high resolution endoscopy of during week 6 of the recurring colitis-driven tumor model. Asterisks indicate large tumors throughout the distal colons. (G) Colon histopathology scores reveal the severity of inflammation, epithelial defects, crypt atrophy, dysplasia, hyperplasia, and area affected in hematoxylin and eosin–stained sections through the mid and distal colon shown, as in Fig. S3. These scores were summed together to generate a HAI. Data shown are representative of three independent experiments and depict the mean ± SEM. Error bars have been omitted from the weight loss data for clarity of presentation. The symbol # indicates P < 0.05 between the AOM/mock and AOM/DSS-treated WT; * indicates P < 0.05 between the gene-deficient strains and WT. For the survival study: WT AOM/mock, n = 6; Casp1−/− n = 8; Pycard−/− n = 9; WT n = 9. For all other datasets: WT AOM, n = 3; WT, n = 9; Pycard−/−, n = 6; Casp1−/−, n = 3.
Figure 4.
Figure 4.
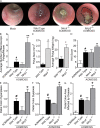
Reduced IL-1β and IL-18 production in colons isolated from Pycard and caspase-1 deficient mice. Colons isolated from the indicated AOM+DSS-challenged mice were cultured overnight and IL-1β (A), IL-18 (B), and TNF (C) in the supernatants was measured by ELISA. Data shown are representative of at least three independent experiments and depict the mean ± SEM. The symbol # indicates P < 0.05 between the AOM/mock and AOM/DSS-treated WT; * indicates P < 0.05 between the gene-deficient strains and WT. AOM/mock, n = 3; WT, n = 6; Pycard−/−, n = 3; Casp1−/−, n = 3.
Figure 5.
Figure 5.
Loss of Nlrp3 results in augmented features of ulcerative colitis in the inflammation-driven tumor model. (A) Schematic of the CAC model using the chemical carcinogen AOM and DSS. (B and C) Weight loss measured throughout the colitis driven tumor progression model in WT, Nlrp3−/−, and Nlrc4−/− mice (difference observed during the final week of study in C is not statistically significant). (D) Clinical scores reflecting weight loss, loose stool consistency, and amounts of blood present in stool and rectum. (E) Colon length. (F) Gross morphology revealing areas of excessive wall thickening and hemorrhage. Data shown are representative of 3 independent experiments and depict the mean ± SEM. Error bars have been omitted from the weight loss data for clarity of presentation. The symbols # and § indicate P < 0.05 and P < 0.01, respectively, between the AOM/mock and AOM/DSS-treated WT; * indicates P < 0.05 between the Nlrp3−/− and WT mice. WT, n = 15; Nlrp3−/−, n = 12; Nlrc4−/−, n = 4; WT AOM/mock, n = 3.
Figure 6.
Figure 6.
NLRP3 mediates gastrointestinal tumorigenesis in the CAC model. (A) Endoscopic analysis of mice during week 6 of the recurring CAC model. (B) Macroscopic polyps were quantified in indicated mice. (C) Size and weight of representative macroscopic polyps from indicated mice. (D) Composite HAI scores. (E–G) Distal colon hyperplasia (E), dysplasia (F), and area involved with disease (G). Data are representative of three independent experiments. The symbol # indicates P < 0.05 between the AOM/mock and AOM/DSS-treated WT; * and ** indicate P < 0.05 and P < 0.01, respectively, between the Nlrp3−/− and WT mice. WT AOM, n = 3; WT, n = 10; Nlrc4−/−, n = 3; Nlrp3−/−, n = 6.
Figure 7.
Figure 7.
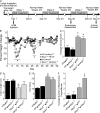
Mice receiving bone marrow from Nlrp3−/− animals develop enhanced gastrointestinal disease. (A) Schematic of the four stage model of inflammation-driven tumor progression using the chemical carcinogen AOM in bone marrow chimeric mice. (B) Weight change of indicated BM chimeras. (C) Composite clinical scores reflecting weight loss, loose stool consistency, and blood in the stool and rectum. (D) Colon length. (E) Composite HAI scores. (F) Quantification of macroscopic polyps. Data depict the mean ± SEM and are representative of three independent experiments. The symbol * indicates P < 0.05 in a comparison of the WT→WT control to the other three groups. WT→Nlrp3−/−, n = 7; Nlrp3−/−→WT, n = 7; WT→WT, n = 3; Nlrp3−/−Nlrp3−/−, n = 3.

Comment in

Similar articles

Cited by

References

    1. Adachi O., Kawai T., Takeda K., Matsumoto M., Tsutsui H., Sakagami M., Nakanishi K., Akira S. 1998. Targeted disruption of the MyD88 gene results in loss of IL-1- and IL-18-mediated function. Immunity. 9:143–150 10.1016/S1074-7613(00)80596-8 - DOI - PubMed
    1. Agostini L., Martinon F., Burns K., McDermott M.F., Hawkins P.N., Tschopp J. 2004. NALP3 forms an IL-1beta-processing inflammasome with increased activity in Muckle-Wells autoinflammatory disorder. Immunity. 20:319–325 10.1016/S1074-7613(04)00046-9 - DOI - PubMed
    1. Akira S., Uematsu S., Takeuchi O. 2006. Pathogen recognition and innate immunity. Cell. 124:783–801 10.1016/j.cell.2006.02.015 - DOI - PubMed
    1. Araki A., Kanai T., Ishikura T., Makita S., Uraushihara K., Iiyama R., Totsuka T., Takeda K., Akira S., Watanabe M. 2005. MyD88-deficient mice develop severe intestinal inflammation in dextran sodium sulfate colitis. J. Gastroenterol. 40:16–23 10.1007/s00535-004-1492-9 - DOI - PubMed
    1. Barber M.D., Powell J.J., Lynch S.F., Fearon K.C., Ross J.A. 2000. A polymorphism of the interleukin-1 beta gene influences survival in pancreatic cancer. Br. J. Cancer. 83:1443–1447 10.1054/bjoc.2000.1479 - DOI - PMC - PubMed

Publication types

MeSH terms