

doi: 10.1371/journal.pcbi.1000655.
How to understand the cell by breaking it: network analysis of gene perturbation screens
Affiliations
- PMID: 20195495
- PMCID: PMC2829042
- DOI: 10.1371/journal.pcbi.1000655
Item in Clipboard
How to understand the cell by breaking it: network analysis of gene perturbation screens
PLoS Comput Biol.
.
No abstract available
Conflict of interest statement
The author has declared that no competing interests exist.
Figures
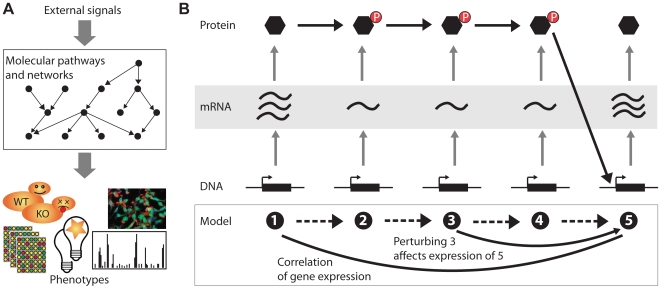
(A) Phenotypes are the response of the cell to external signals mediated by cellular networks and pathways. The goal of computation is to reconstruct these networks from the observed phenotypes. (B) Global molecular phenotypes like gene expression allow a view inside the cell but also have limitations. This is exemplified here in a cartoon pathway adapted from showing a cascade of five genes/proteins (1–5). Proteins 1–3 form a kinase cascade, 4 is a transcription factor acting on 5. Up-regulation of 1 starts information flow in the cascade and results in 5 being turned on. In gene expression data this is visible as a correlation between 1 and 5 (represented as an undirected edge in the model). Experimentally perturbing a gene, say 3, removes the corresponding protein from the cascade, breaks the information flow, and results in an expression change at 5 (represented as an arrow in the model). However, the different phosphorylation and activation states of proteins 2–4 will most probably not be visible as changes in gene expression. Thus, because of the pathway mostly acting on the protein level most parts of the cascade (dashed arrows in the model) can not be inferred from gene expression data directly.
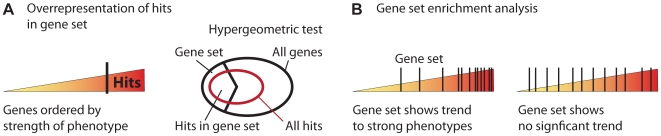
(A) In the first approach a cutoff is applied to select the hits with strongest phenotypes. A hyper-geometric test then evaluates if the overlap between the hits and a given gene set is surprisingly large (or small) compared to the overlap with a random set. (B) A second approach does not need a cutoff. It maps the gene set (black bars) onto the observed phenotypes and quantifies if there is a significant trend or if the genes are spread out uniformly over the whole range.
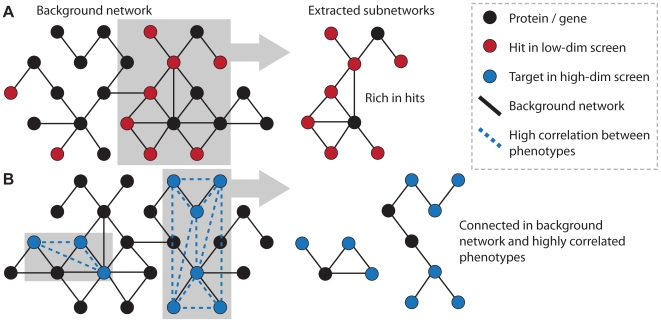
Different patterns in the graph point to a common cellular mechanism causing a phenotype: (A) hits in a low-dimensional screen (red nodes) clustering in highly connected subnetworks, and (B) high correlation between high-dimensional phenotypes of target genes connected in the background network. The black graph represents any type of background network.
Similar articles
-
Introduction: Cancer Gene Networks.Methods Mol Biol. 2017;1513:1-9. doi: 10.1007/978-1-4939-6539-7_1. Methods Mol Biol. 2017. PMID: 27807826
-
Mining and state-space modeling and verification of sub-networks from large-scale biomolecular networks.BMC Bioinformatics. 2007 Aug 31;8:324. doi: 10.1186/1471-2105-8-324. BMC Bioinformatics. 2007. PMID: 17764552 Free PMC article.
-
KCML: a machine-learning framework for inference of multi-scale gene functions from genetic perturbation screens.Mol Syst Biol. 2020 Mar;16(3):e9083. doi: 10.15252/msb.20199083. Mol Syst Biol. 2020. PMID: 32141232 Free PMC article.
-
Complex networks and simple models in biology.J R Soc Interface. 2005 Dec 22;2(5):419-30. doi: 10.1098/rsif.2005.0067. J R Soc Interface. 2005. PMID: 16849202 Free PMC article. Review.
-
From molecules to cellular networks: past and future outlook.Phys Biol. 2017 Feb 16;14(1):013003. doi: 10.1088/1478-3975/aa5b6a. Phys Biol. 2017. PMID: 28140350 Review.
Cited by
-
From pixels to phenotypes: Integrating image-based profiling with cell health data as BioMorph features improves interpretability.Mol Biol Cell. 2024 Mar 1;35(3):mr2. doi: 10.1091/mbc.E23-08-0298. Epub 2024 Jan 3. Mol Biol Cell. 2024. PMID: 38170589 Free PMC article.
-
Plato's cave algorithm: inferring functional signaling networks from early gene expression shadows.PLoS Comput Biol. 2010 Jun 24;6(6):e1000828. doi: 10.1371/journal.pcbi.1000828. PLoS Comput Biol. 2010. PMID: 20585619 Free PMC article.
-
Incorporating interaction networks into the determination of functionally related hit genes in genomic experiments with Markov random fields.Bioinformatics. 2017 Jul 15;33(14):i170-i179. doi: 10.1093/bioinformatics/btx244. Bioinformatics. 2017. PMID: 28881978 Free PMC article.
-
Shrinkage estimation of dispersion in Negative Binomial models for RNA-seq experiments with small sample size.Bioinformatics. 2013 May 15;29(10):1275-82. doi: 10.1093/bioinformatics/btt143. Epub 2013 Apr 14. Bioinformatics. 2013. PMID: 23589650 Free PMC article.
-
Identification of highly connected and differentially expressed gene subnetworks in metastasizing endometrial cancer.PLoS One. 2018 Nov 1;13(11):e0206665. doi: 10.1371/journal.pone.0206665. eCollection 2018. PLoS One. 2018. PMID: 30383835 Free PMC article.
References
-
- Winzeler EA, Shoemaker DD, Astromoff A, Liang H, Anderson K, et al. Functional characterization of the S. cerevisiae genome by gene deletion and parallel analysis. Science. 1999;285:901–906. - PubMed
-
- Fuchs F, Boutros M. Cellular phenotyping by RNAi. Brief Funct Genomic Proteomic. 2006;5:52–56. - PubMed
-
- Moffat J, Sabatini D. Building mammalian signalling pathways with RNAi screens. Nat Rev Mol Cell Biol. 2006;7:177–187. - PubMed
-
- Boutros M, Ahringer J. The art and design of genetic screens: RNA interference. Nat Rev Genet. 2008;9:554–566. - PubMed
MeSH terms
LinkOut - more resources
Full Text Sources
Other Literature Sources
