

Biodistribution mechanisms of therapeutic monoclonal antibodies in health and disease
- PMID: 19924542
- PMCID: PMC2811642
- DOI: 10.1208/s12248-009-9157-5
Biodistribution mechanisms of therapeutic monoclonal antibodies in health and disease
Abstract
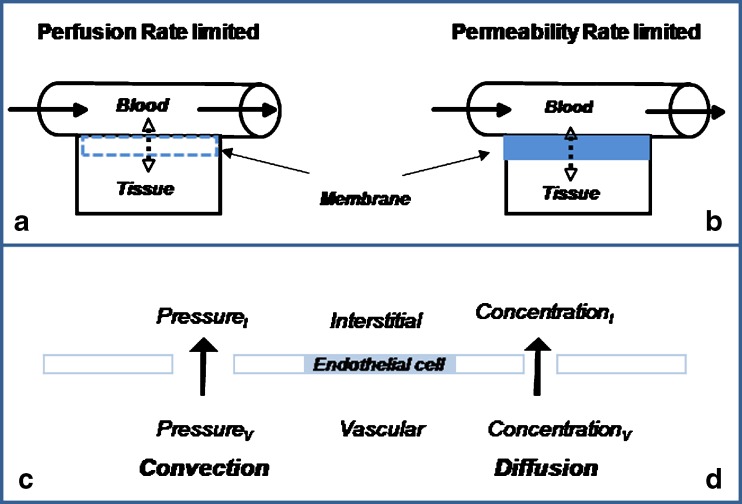
The monoclonal antibody market continues to witness an impressive rate of growth and has become the leading source of expansion in the biologic segment within the pharmaceutical industry. Currently marketed monoclonal antibodies target a diverse array of antigens. These antigens are distributed in a variety of tissues such as tumors, lungs, synovial fluid, psoriatic plaques, and lymph nodes. As the concentration of drug at the proximity of the biological receptor determines the magnitude of the observed pharmacological responses, a significant consideration in effective therapeutic application of monoclonal antibodies is a thorough understanding of the processes that regulate antibody biodistribution. Monoclonal antibody distribution is affected by factors such as molecular weight, blood flow, tissue and tumor heterogeneity, structure and porosity, target antigen density, turnover rate, and the target antigen expression profile.
Figures
Similar articles
-
Tissue distribution of humanized anti-human Fas monoclonal antibody (R-125224) based on fas antigen-antibody reaction in collagen-induced arthritis monkeys.Life Sci. 2007 May 8;80(22):2005-14. doi: 10.1016/j.lfs.2007.02.043. Epub 2007 Mar 12. Life Sci. 2007. PMID: 17477938
-
Selective radiation of hematolymphoid tissue delivered by anti-CD45 antibody.Cancer Res. 1992 Mar 1;52(5):1228-34. Cancer Res. 1992. PMID: 1531324
-
Tissue distribution and receptor-mediated clearance of anti-CD11a antibody in mice.Drug Metab Dispos. 2005 May;33(5):623-9. doi: 10.1124/dmd.104.002584. Epub 2005 Jan 26. Drug Metab Dispos. 2005. PMID: 15673599
-
Rheumatology: a force for change in monoclonal antibodies.Curr Pharm Des. 2015;21(17):2179-86. doi: 10.2174/1381612821666150310142202. Curr Pharm Des. 2015. PMID: 25760300 Review.
-
Assessments of antibody biodistribution.J Clin Pharmacol. 2015 Mar;55 Suppl 3:S29-38. doi: 10.1002/jcph.365. J Clin Pharmacol. 2015. PMID: 25707961 Review.
Cited by
-
Pharmacokinetics, pharmacodynamics and physiologically-based pharmacokinetic modelling of monoclonal antibodies.Clin Pharmacokinet. 2013 Feb;52(2):83-124. doi: 10.1007/s40262-012-0027-4. Clin Pharmacokinet. 2013. PMID: 23299465 Review.
-
Monoclonal antibody therapy for Junin virus infection.Proc Natl Acad Sci U S A. 2016 Apr 19;113(16):4458-63. doi: 10.1073/pnas.1600996113. Epub 2016 Apr 4. Proc Natl Acad Sci U S A. 2016. PMID: 27044104 Free PMC article.
-
Biodistribution and function of coupled polymer-DNA origami nanostructures.Sci Rep. 2023 Nov 10;13(1):19567. doi: 10.1038/s41598-023-46351-1. Sci Rep. 2023. PMID: 37949918 Free PMC article.
-
A narrative review of the calcitonin peptide family and associated receptors as migraine targets: Calcitonin gene-related peptide and beyond.Headache. 2022 Oct;62(9):1093-1104. doi: 10.1111/head.14388. Epub 2022 Oct 13. Headache. 2022. PMID: 36226379 Free PMC article. Review.
-
Successful radioimmunotherapy of established syngeneic rat colon carcinoma with 211At-mAb.EJNMMI Res. 2013 Apr 4;3(1):23. doi: 10.1186/2191-219X-3-23. EJNMMI Res. 2013. PMID: 23557183 Free PMC article.
References
-
- Humira. Prescribing Information: http://www.fda.gov/ohrms/dockets/ac/03/briefing/3930B1_02_B-Abbott-Humir.... 2009.
-
- Mascelli MA, Zhou H, Sweet R, Getsy J, Davis HM, Graham M, et al. Molecular, biologic, and pharmacokinetic properties of monoclonal antibodies: impact of these parameters on early clinical development. J Clin Pharmacol. 2007;47(5):553–565. - PubMed
-
- Xu Z, Vu T, Lee H, Hu C, Ling J, Yan H, et al. Population pharmacokinetics of golimumab, an anti-tumor necrosis factor-{alpha} human monoclonal antibody, in patients with psoriatic arthritis. J Clin Pharmacol. 2009;49(9):1056–1070. - PubMed
-
- Zhou H. Clinical pharmacokinetics of etanercept: a fully humanized soluble recombinant tumor necrosis factor receptor fusion protein. J Clin Pharmacol. 2005;45(5):490–497. - PubMed
Publication types
MeSH terms
Substances
LinkOut - more resources
Full Text Sources
Other Literature Sources
Research Materials
