. 2009 Nov 13;36(3):500-11.
doi: 10.1016/j.molcel.2009.10.021.

GM1-ganglioside accumulation at the mitochondria-associated ER membranes links ER stress to Ca(2+)-dependent mitochondrial apoptosis

Affiliations

GM1-ganglioside accumulation at the mitochondria-associated ER membranes links ER stress to Ca(2+)-dependent mitochondrial apoptosis

Renata Sano et al. Mol Cell. .

Abstract

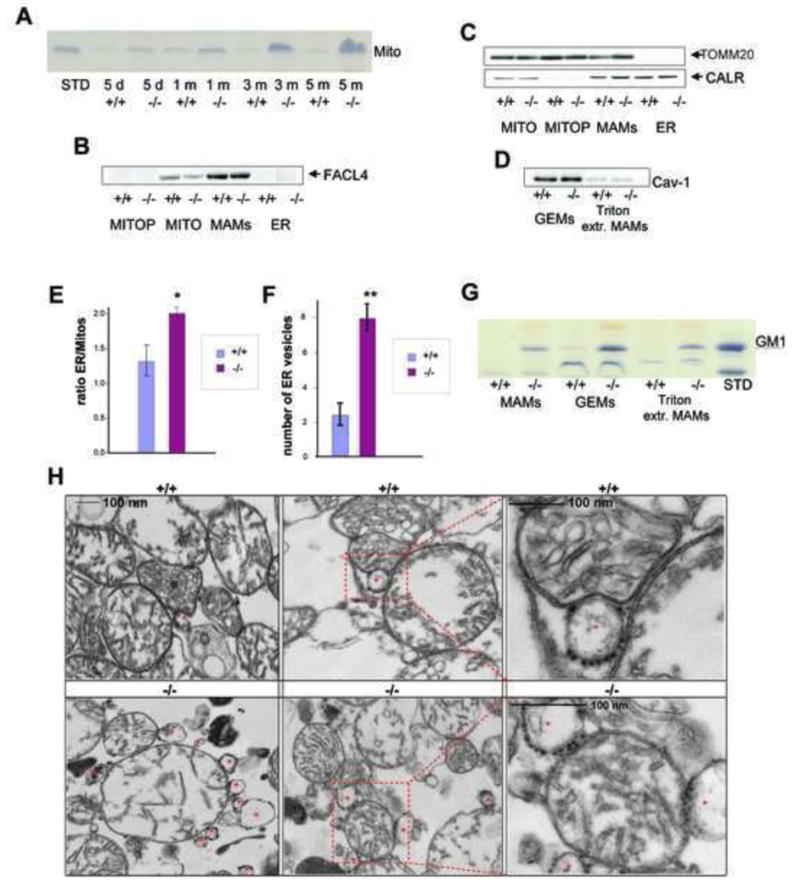
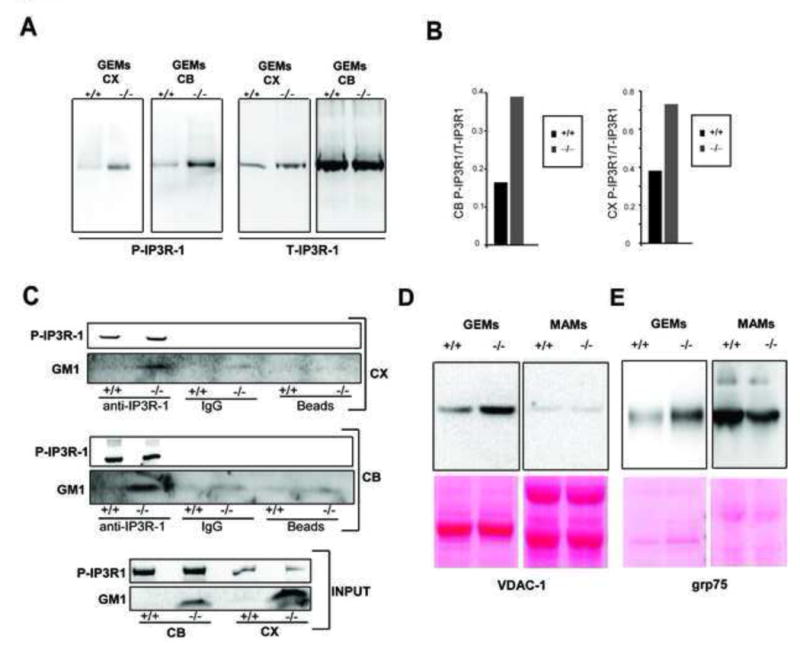
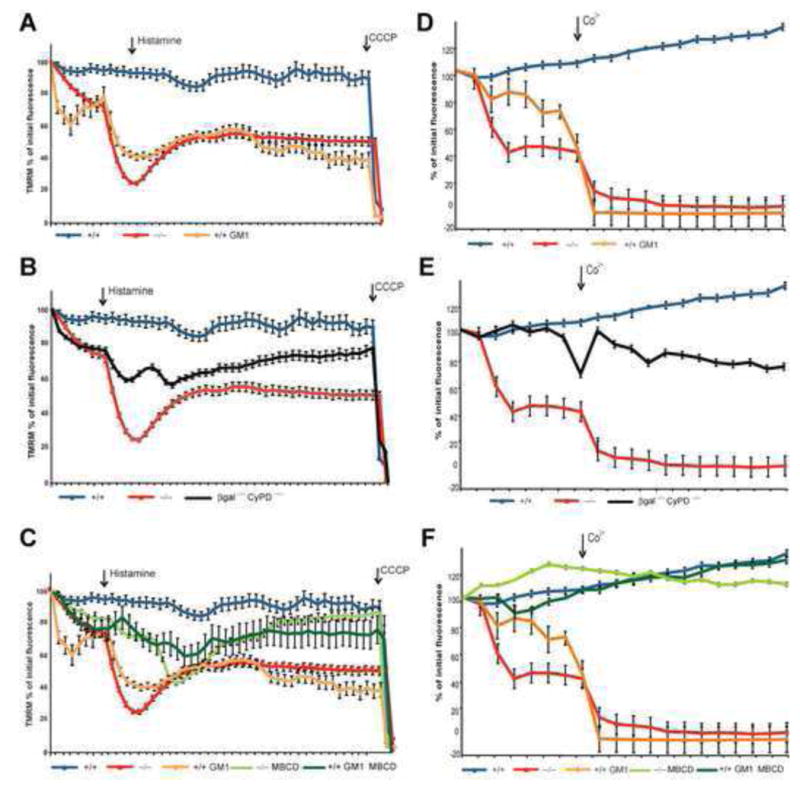
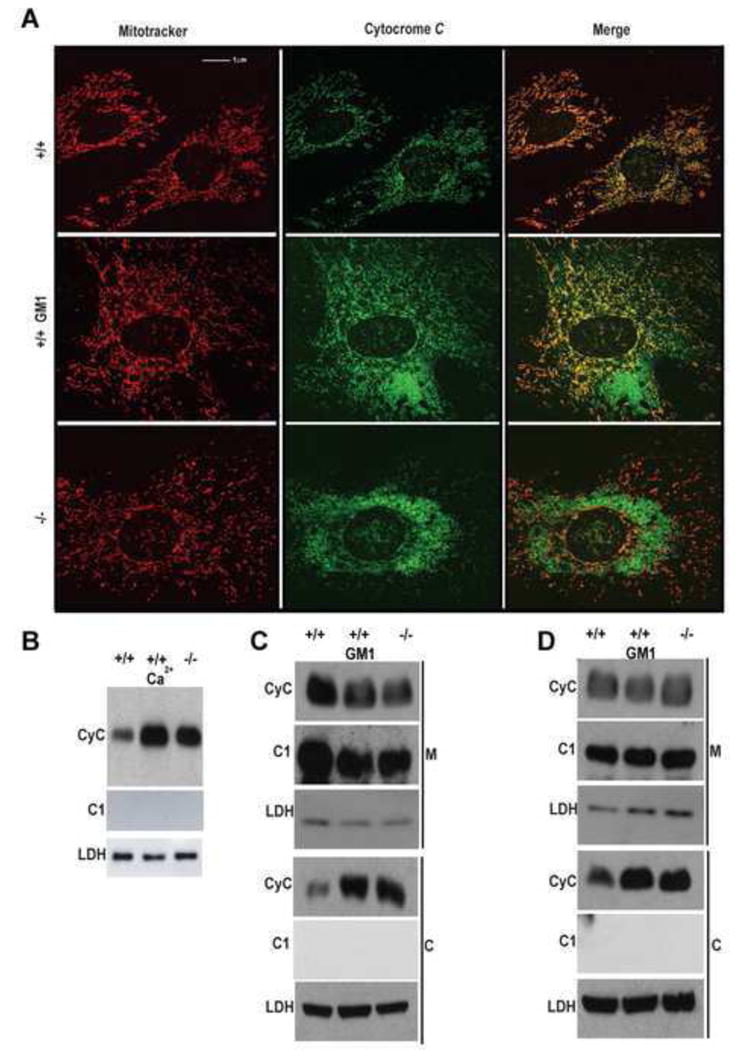
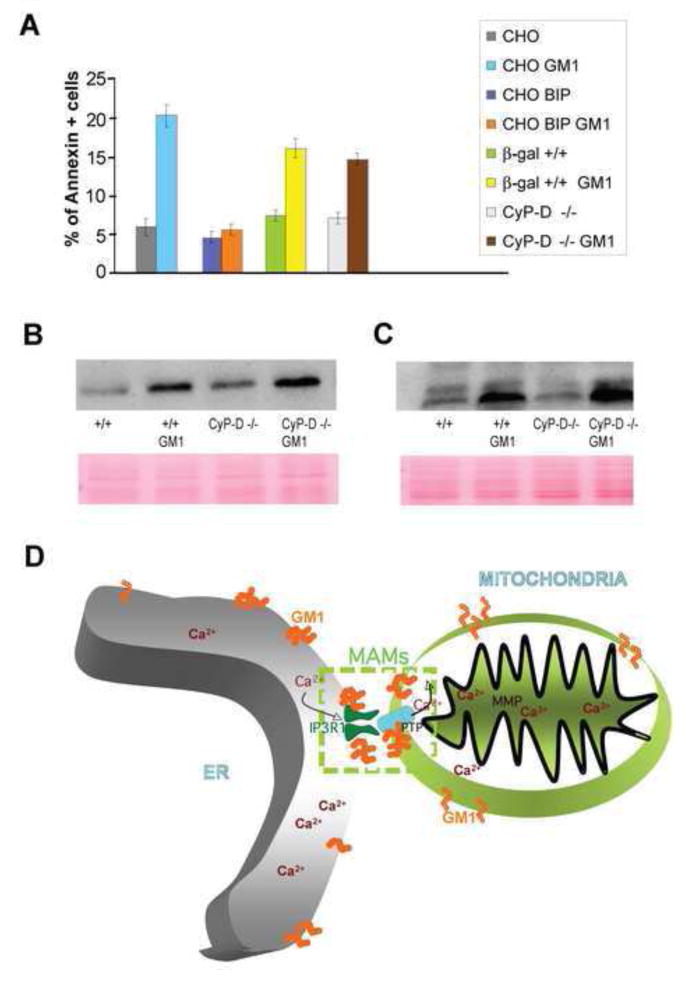
Mitochondria-associated ER membranes, or MAMs, define the sites of endoplasmic reticulum/mitochondria juxtaposition that control Ca(2+) flux between these organelles. We found that in a mouse model of the human lysosomal storage disease GM1-gangliosidosis, GM1-ganglioside accumulates in the glycosphingolipid-enriched microdomain (GEM) fractions of MAMs, where it interacts with the phosphorylated form of IP3 receptor-1, influencing the activity of this channel. Ca(2+) depleted from the ER is then taken up by the mitochondria, leading to Ca(2+) overload in this organelle. The latter induces mitochondrial membrane permeabilization (MMP), opening of the permeability transition pore, and activation of the mitochondrial apoptotic pathway. This study identifies the GEMs as the sites of Ca(2+) diffusion between the ER and the mitochondria. We propose a new mechanism of Ca(2+)-mediated apoptotic signaling whereby GM1 accumulation at the GEMs alters Ca(2+) dynamics and acts as a molecular effector of both ER stress-induced and mitochondria-mediated apoptosis of neuronal cells.


Figures

Figure 1
Figure 1. GM1 Progressively Accumulates Mitochondria and MAMs Isolated from β-Gal−/− Brains
(A) TLC of lipid extracts (corresponding to 100 μg protein) from mitochondrial fractions isolated from β-gal+/+ and β-gal−/− brains (d=days and m=months). Plates were developed with resorcinol to evidence gangliosides. Purified GM1 was used as standard (STD). (B) Immunoblots of crude mitochondria (MITO), ER, purified mitochondria (MITO P) and MAMs were probed with anti-FACL4, a marker of the MAMs. (C) Immunoblots of the same fractions as in B probed with anti-TOMM20 and anti-calreticulin (CALR), markers of mitochondria and ER, respectively. (D) Immunoblots of GEMs extracted from MAM preparations of β-gal+/+ and β-gal−/− brains were probed with caveolin-1 antibody (Cav-1). (E) The ER/mitochondria markers ratio was calculated by densitometric analysis of single bands on immunoblots probed with TOMM20 (mitochondrial marker) and calreticulin (ER marker) (Quantity One 4.5, 1 D Analysis Software, BioRad). Values are expressed as mean ± standard deviation of three independent experiments. Groups were compared by the Student t-test for unpaired samples. P< 0.05 (*) (F) The numbers of ER vesicles in close apposition to mitochondria were counted in 20 electron microscopy grids from β-gal+/+ and β-gal−/− mitochondrial brain fractions. Values are expressed as mean ± s.d. Groups were compared by the Student t-test for unpaired samples. Asterisk denotes mean (± s.d) that is significantly different from control. P<0.0001(**). (G) TLC analysis of lipids (corresponding to 100 μg protein) from the MAMs, and the Triton extracted fractions (Triton extr. MAMs) and Triton insoluble fractions (GEMs) of the MAMs. Purified GM1 was used as standard. (H) Representative electron micrographs of mitochondria isolated from β-gal+/+ and β-gal−/− brains. Asterisks denote ER vesicles containing ribosomes.
Figure 2
Figure 2. IP3R-1 Regulates Ca2+ Dynamics in GM1-Accumulating Cells
(A) The phosphorylated and total IP3R-1 were visualized on immunoblots containing GEMs, purified from MAMs of β-gal+/+ and β-gal−/− cerebellum (CB) and cortex (CX) extracts, probed first with a phospho-IP3R (Ser1756) antibody (P-IP3R-1) and then with a total IP3R-1 antibody (T-IP3R-1). (B) Densitometric analyses of bands from immunoblots of GEM fractions isolated from MAMs of β-gal+/+ or β-gal−/− cerebellum (CB), (left panel) and cortex (CX), (right panel) extracts, probed with an antibody against P–IP3R-1 and with an antibody against total IP3R-1 (T-IP3R-1). Results are expressed as P–IP3R/T-IP3R intensities ratio. (C) Co-immunoprecipitation of P-IP3R-1 and GM1 from β-gal+/+ and β-gal−/− cerebellum (CB) and cortex (CX) using total IP3R-1 antibody was visualized on immunoblots probed with HRP-conjugated β-subunit of Cholera toxin (GM1) or the P-IP3R antibody. IgG and protein G beads were used as negative controls. Immunoblots of IP3R-1 and GM1 in CB and CX extracts (30μg) are shown as INPUT. (D) (E) Levels of the VDAC-1 and grp75 were assessed in GEMs and in total MAMs of β-gal+/+ and β-gal−/− brains. Ponceau staining of the membranes were used for equal protein loading.
Figure 3
Figure 3. MAMs/GEMs are Responsible for Mitochondrial Ca2+ Overload and Apoptosis in GM1-Accumulating Cells
(A) Levels of mitochondrial Ca2+ in β-gal−/−, β-gal+/+ loaded with GM1 (treated or not treated with MBCD) and β-gal−/−/CyP-D−/− MEFs were measured ratiometrically using mitochondria-targeted pericam and compared to those of wild-type cells. Mitochondrial Ca2+ measurements are shown at baseline and at peak values in response to a pulse of histamine. Values are expressed as mean ± standard deviation of twenty individual mitochondria in an average of 15 cells. Groups were compared by the Student t-test for unpaired samples. (*P<0.05, **P<0.01) (B) Inmmunoblots of MAMs and MBCD-extracted MAMs probed with HRP-conjugated β-subunit of Cholera toxin (GM1). (C and D) β-gal−/− and β-gal+/+ MEFs were transfected with MFN2 siRNA. Untreated cells, mock transfected cells and cells transfected with a scrambled siRNA were used as controls. Cell lysates were analyzed on immunoblots probed with anti MFN2 and anti actin antibodies. (E and F) β-gal−/− and β-gal+/+ MEFs were transfected with IP3R-1 siRNA. Untreated cells, mock transfected cells and cells transfected with a scrambled siRNA were used as controls. Cell lysates were analyzed on immunoblots probed with anti IP3R-1 and anti actin antibodies. (G) Flow cytometry analyses of : Annexin V+ β-gal−/− and β-gal+/+ MEFs untreated or treated with increasing concentration of MBCD (50, 100, 150 μM); β-gal−/− and β-gal+/+ MEFs transfected with MFN2 or IP3R-1 siRNAs; mock transfected or scrambled siRNA transfected cells were used as controls.
Figure 4
Figure 4. Effect of GM1 on Mitochondrial Transmembrane Potential and Opening of the PTP
(A) Live measurements of TMRM fluorescence in individual mitochondria of β-gal+/+, β-gal+/+ loaded with GM1, and β-gal−/− MEFs pulsed with histamine and depolarized with CCCP as indicated. Values are expressed as percentage of initial TMRM fluorescence and represent the mean ± SE of 20 independent measurements. (B) Live measurements of TMRM fluorescence in individual mitochondria of β-gal−/−/CyP-D−/− MEFs compared to TMRM fluorescence in β-gal−/− and β-gal+/+ mitochondria. Values are expressed as percentage of initial TMRM fluorescence and represent the mean ± SE of 20 independent measurements. (C) Restoration of the ΔΨm in β-gal+/+ loaded with GM1 and β-gal−/− MEFs treated with MBCD. Values are expressed as percentage of initial TMRM fluorescence and represent the mean ± SE of 20 independent measurements. (D) Live measurements of mitochondrial calcein release in β-gal+/+, β-gal+/+ loaded with GM1, and β-gal−/− MEFs pulsed with CoCl2. Data are expressed as percentage of initial calcein fluorescence and represent the mean ± SE of at least 20 independent measurements. (E) Live measurements of mitochondrial calcein release in β-gal−/−/CyP-D−/− MEFs pulsed with CoCl2 and compared to the values obtained in β-gal−/− and β-gal+/+ mitochondria. Data are expressed as percentage of initial calcein fluorescence and represent the mean ± SE of at least 20 independent measurements. (F) Prevention of PTP opening β-gal+/+ loaded with GM1 and β-gal−/− MEFs treated with MBCD. Data are expressed as percentage of initial calcein fluorescence and represent the mean ± SE of at least 20 independent measurements.
Figure 5
Figure 5. GM1 Promotes the Release of Mitochondrial Proteins into the Cytosol
(A) MEFs were co-stained with Mitotracker (red) and an anti-cytochrome c antibody (green). The merged pictures demonstrated increased levels of cytochrome c in the cytosol of GM1-loaded β-gal+/+, and β-gal−/− cells, while in untreated β-gal+/+ cells most of the cytochrome c is localized within the mitochondria (yellow). (B) Cytochrome c release was monitored in isolated mitochondria from β-gal+/+ and β-gal−/− brains after incubation with GM1 or Ca2+. Cytosolic fractions were analyzed on immunoblots probed with cytochrome c antibody. Complex I (CI) and LDH were used as standard controls for the cytosol. (C) Mitochondria (M) and cytosolic fractions (C) isolated from β-gal+/+, GM1-loaded β-gal+/+ and β-gal−/− MEFs were probed on Immuno blots with an anti-cytochrome c antibody (CyC). Complex I (CI) and LDH were used as standard controls for both mitochondria and cytosol. (D) Mitochondria (M) and cytosolic fractions (C) isolated from β-gal+/+, GM1-loaded β-gal+/+ and β-gal−/− neurospheres were probed as in (C).
Figure 6
Figure 6. Ca2+ Blockers and CsA Prevent Apoptosis, Rescue ATP Levels and Abolish Abnormal ROS Production in GM1-Storing Cells
(A) Flow cytometry analysis of Annexin V β-gal+/+, GM1-loaded β-gal+/+ and β-gal−/− MEFs. In some instances, cells were preincubated with BAPTA, CsA and Z-VAD-fmk. Values are expressed as mean ± standard deviation of three independent experiments. Groups were compared by the Student t-test for unpaired samples. P< 0.05 (*) (B) ATP levels in β-gal+/+, GM1-loaded β-gal+/+ and β-gal−/− MEFs were measured using a luciferase-based assay. Where indicated, cells were pre-incubated with BAPTA and CsA prior to ATP analysis. Staurosporine was used as positive controls. Values are expressed as mean ± standard deviation of three independent experiments. Groups were compared by the Student t-test for unpaired samples. P< 0.05 (*) (C) Reactive oxygen species (ROS) were measured in β-gal+/+, GM1-loaded β-gal+/+ and β-gal−/− MEFs with the fluorescent probe 2′,7′-dichlorofluorescein (H2DCFDA). The progressive increase in ROS levels was monitored by the fluorescence emitted after reaction with intracellular ROS. Addition of CsA and BAPTA normalized ROS levels in GM1-accumulating cells. Data are expressed as mean ± SD of 4 distinct experiments; groups were compared by the Student t-test for unpaired samples. Asterisks denote mean values ±s.d significantly different from control or from untreated GM1-loaded β-gal+/+ and β-gal−/− (*P<0.05, **P<0.01). (D) Caspase activation was assessed by immunofluorescence analysis using a fluorescent pan caspace inhibitor, caspACE FITC VAD-fmk. Staurosporine was used as positive control.
Figure 7
Figure 7. GM1-Mediated Activation of ER-Stress is Upstream of the Mitochondrial Apoptotic Cascade
(A) Annexin V staining of CHO cells, CHO- overexpressing BiP, as well as β-gal+/+ and CypD−/− MEFs, treated or not with exogenous GM1, were evaluated by FACS analysis and expressed as percentage of Annexin V positivity. (B), (C) Levels of XBP-1 and caspase-3 in β-gal+/+ and CypD-−/− MEFs were visualized on immunoblots probed with an anti-rat antibody against these proteins. Ponceau staining of the membranes was used to confirm equal protein loading. (D) Proposed Model Linking ER-Mitochondria Ca2+ Signalling and Neuronal Apoptosis in GM1-gangliosidosis.

Similar articles

Cited by

References

    1. Basso E, Fante L, Fowlkes J, Petronilli V, Forte MA, Bernardi P. Properties of the permeability transition pore in mitochondria devoid of Cyclophilin D. J Biol Chem. 2005;280:18558–18561. - PubMed
    1. Bathori G, Csordas G, Garcia-Perez C, Davies E, Hajnoczky G. Ca2+-dependent control of the permeability properties of the mitochondrial outer membrane and voltage-dependent anion-selective channel (VDAC) J Biol Chem. 2006;281:17347–17358. - PubMed
    1. Bernardi P, Krauskopf A, Basso E, Petronilli V, Blachly-Dyson E, Di Lisa F, Forte MA. The mitochondrial permeability transition from in vitro artifact to disease target. FEBS J. 2006;273:2077–2099. - PubMed
    1. Bernardi P, Petronilli V, Di Lisa F, Forte M. A mitochondrial perspective on cell death. Trends Biochem Sci. 2001;26:112–117. - PubMed
    1. d'Azzo A, Tessitore A, Sano R. Gangliosides as apoptotic signals in ER stress response. Cell Death Differ. 2006;13:404–414. - PubMed

Publication types

MeSH terms