

Foxo1 integrates insulin signaling with mitochondrial function in the liver
- PMID: 19838201
- PMCID: PMC3994712
- DOI: 10.1038/nm.2049
Foxo1 integrates insulin signaling with mitochondrial function in the liver
Abstract
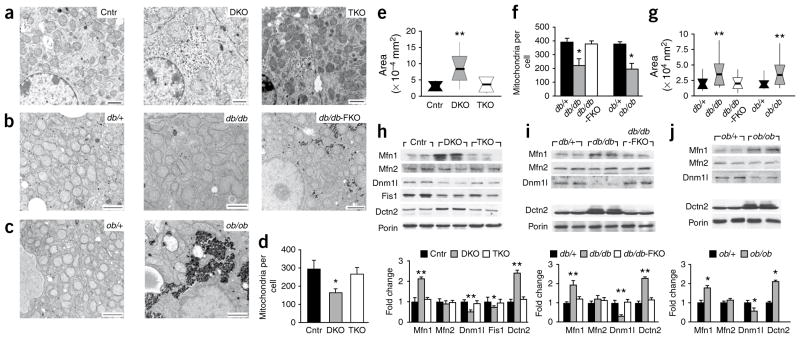
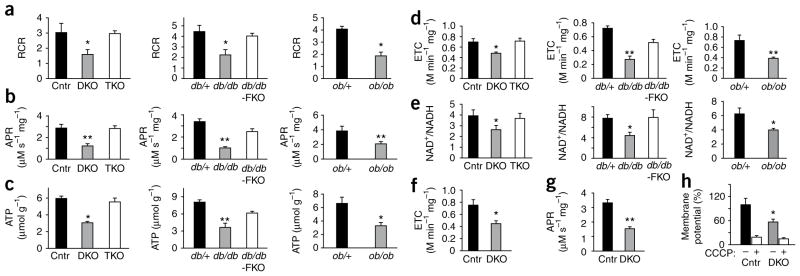
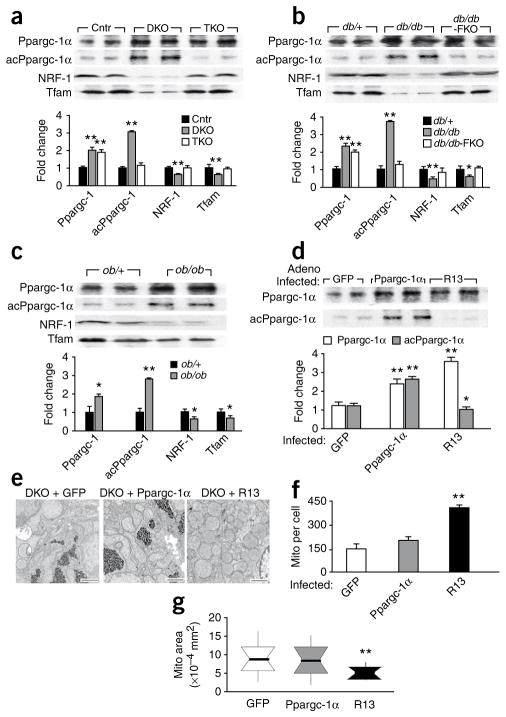
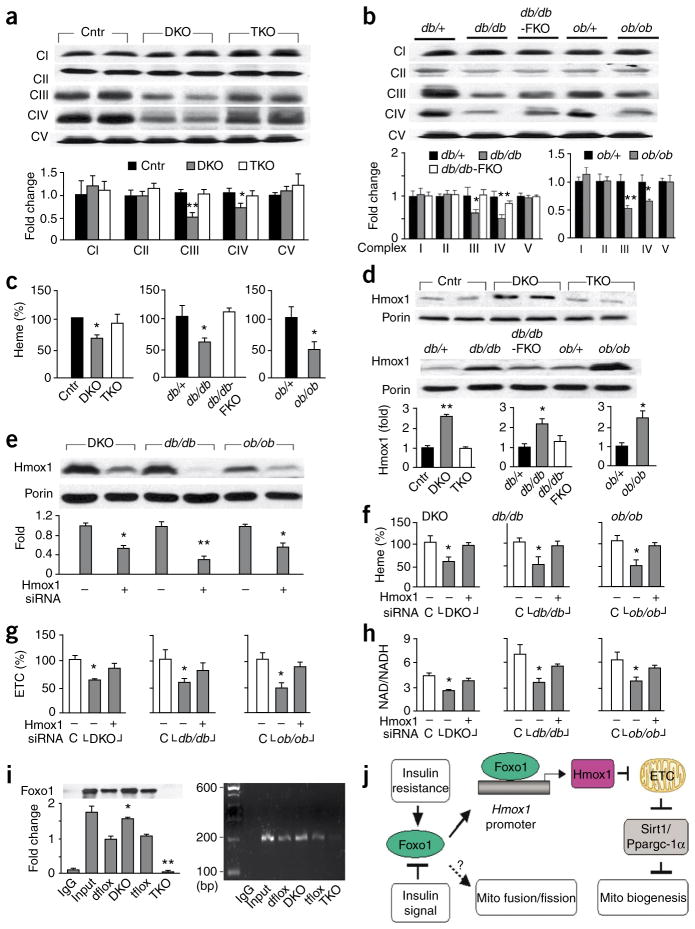
Type 2 diabetes is a complex disease that is marked by the dysfunction of glucose and lipid metabolism. Hepatic insulin resistance is especially pathogenic in type 2 diabetes, as it dysregulates fasting and postprandial glucose tolerance and promotes systemic dyslipidemia and nonalcoholic fatty liver disease. Mitochondrial dysfunction is closely associated with insulin resistance and might contribute to the progression of diabetes. Here we used previously generated mice with hepatic insulin resistance owing to the deletion of the genes encoding insulin receptor substrate-1 (Irs-1) and Irs-2 (referred to here as double-knockout (DKO) mice) to establish the molecular link between dysregulated insulin action and mitochondrial function. The expression of several forkhead box O1 (Foxo1) target genes increased in the DKO liver, including heme oxygenase-1 (Hmox1), which disrupts complex III and IV of the respiratory chain and lowers the NAD(+)/NADH ratio and ATP production. Although peroxisome proliferator-activated receptor-gamma coactivator-1alpha (Ppargc-1alpha) was also upregulated in DKO liver, it was acetylated and failed to promote compensatory mitochondrial biogenesis or function. Deletion of hepatic Foxo1 in DKO liver normalized the expression of Hmox1 and the NAD(+)/NADH ratio, reduced Ppargc-1alpha acetylation and restored mitochondrial oxidative metabolism and biogenesis. Thus, Foxo1 integrates insulin signaling with mitochondrial function, and inhibition of Foxo1 can improve hepatic metabolism during insulin resistance and the metabolic syndrome.
Figures
Similar articles
-
Leucine supplementation increases SIRT1 expression and prevents mitochondrial dysfunction and metabolic disorders in high-fat diet-induced obese mice.Am J Physiol Endocrinol Metab. 2012 Nov 15;303(10):E1234-44. doi: 10.1152/ajpendo.00198.2012. Epub 2012 Sep 11. Am J Physiol Endocrinol Metab. 2012. PMID: 22967499 Free PMC article.
-
Impaired regulation of hepatic glucose production in mice lacking the forkhead transcription factor Foxo1 in liver.Cell Metab. 2007 Sep;6(3):208-16. doi: 10.1016/j.cmet.2007.08.006. Cell Metab. 2007. PMID: 17767907
-
BMI-related progression of atypical PKC-dependent aberrations in insulin signaling through IRS-1, Akt, FoxO1 and PGC-1α in livers of obese and type 2 diabetic humans.Metabolism. 2015 Nov;64(11):1454-65. doi: 10.1016/j.metabol.2015.08.011. Epub 2015 Aug 24. Metabolism. 2015. PMID: 26386696 Free PMC article.
-
FoxO1 integrates insulin signaling to VLDL production.Cell Cycle. 2008 Oct;7(20):3162-70. doi: 10.4161/cc.7.20.6882. Epub 2008 Oct 27. Cell Cycle. 2008. PMID: 18927507 Free PMC article. Review.
-
Insulin signaling meets mitochondria in metabolism.Trends Endocrinol Metab. 2010 Oct;21(10):589-98. doi: 10.1016/j.tem.2010.06.005. Epub 2010 Jul 16. Trends Endocrinol Metab. 2010. PMID: 20638297 Free PMC article. Review.
Cited by
-
Effect of exercise training on insulin sensitivity, mitochondria and computed tomography muscle attenuation in overweight women with and without polycystic ovary syndrome.Diabetologia. 2012 May;55(5):1424-34. doi: 10.1007/s00125-011-2442-8. Epub 2012 Jan 13. Diabetologia. 2012. PMID: 22246378 Clinical Trial.
-
Simple Targeted Assays for Metabolic Pathways and Signaling: A Powerful Tool for Targeted Proteomics.Anal Chem. 2020 Oct 20;92(20):13672-13676. doi: 10.1021/acs.analchem.0c02793. Epub 2020 Sep 21. Anal Chem. 2020. PMID: 32865986 Free PMC article.
-
Role of forkhead transcription factors in diabetes-induced oxidative stress.Exp Diabetes Res. 2012;2012:939751. doi: 10.1155/2012/939751. Epub 2012 Jan 31. Exp Diabetes Res. 2012. PMID: 22454632 Free PMC article. Review.
-
Histone H3 lysine 4 methylation signature associated with human undernutrition.Proc Natl Acad Sci U S A. 2018 Nov 27;115(48):E11264-E11273. doi: 10.1073/pnas.1722125115. Epub 2018 Nov 12. Proc Natl Acad Sci U S A. 2018. PMID: 30420518 Free PMC article.
-
Insulin resistance in ischemic stroke: Mechanisms and therapeutic approaches.Front Endocrinol (Lausanne). 2022 Dec 15;13:1092431. doi: 10.3389/fendo.2022.1092431. eCollection 2022. Front Endocrinol (Lausanne). 2022. PMID: 36589857 Free PMC article. Review.
References
Publication types
MeSH terms
Substances
Grants and funding
LinkOut - more resources
Full Text Sources
Other Literature Sources
Medical
Molecular Biology Databases
Research Materials
Miscellaneous
