. 2009 Sep 24;35(6):856-67.
doi: 10.1016/j.molcel.2009.09.006.

Hypoxia-inducible mir-210 regulates normoxic gene expression involved in tumor initiation

Affiliations

Hypoxia-inducible mir-210 regulates normoxic gene expression involved in tumor initiation

Xin Huang et al. Mol Cell. .

Abstract

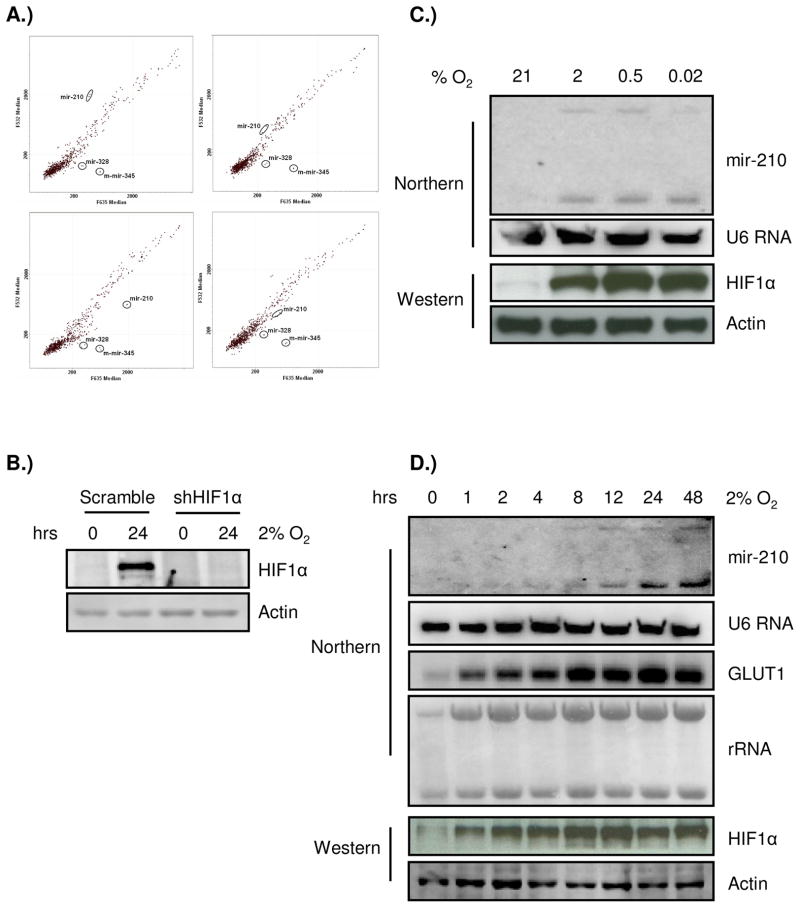
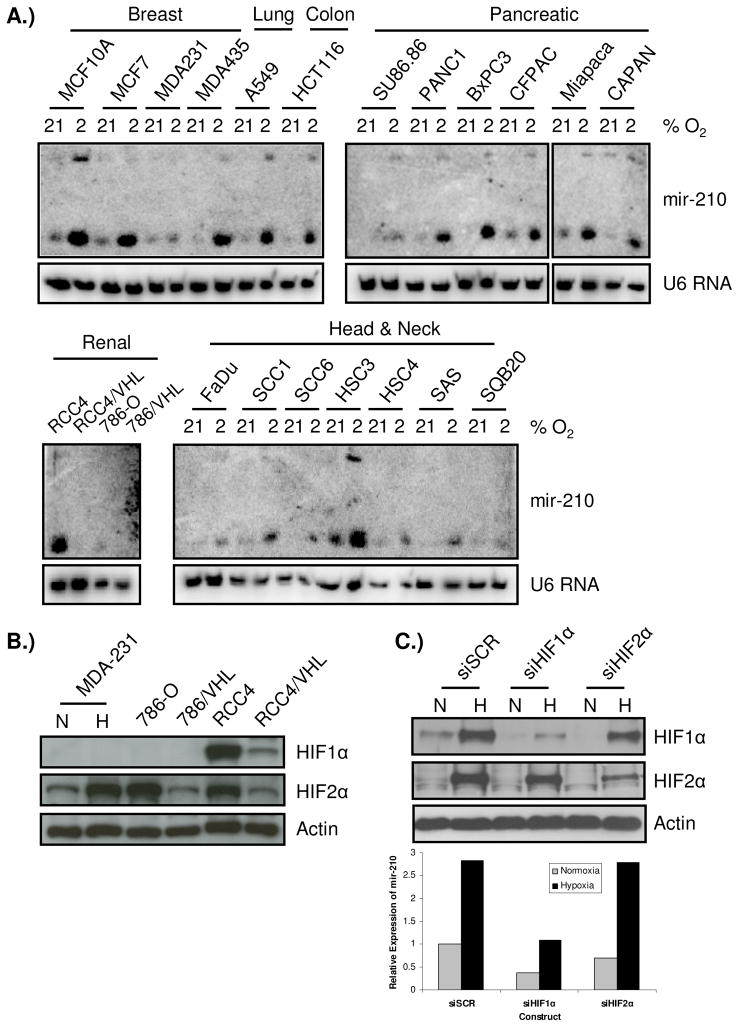
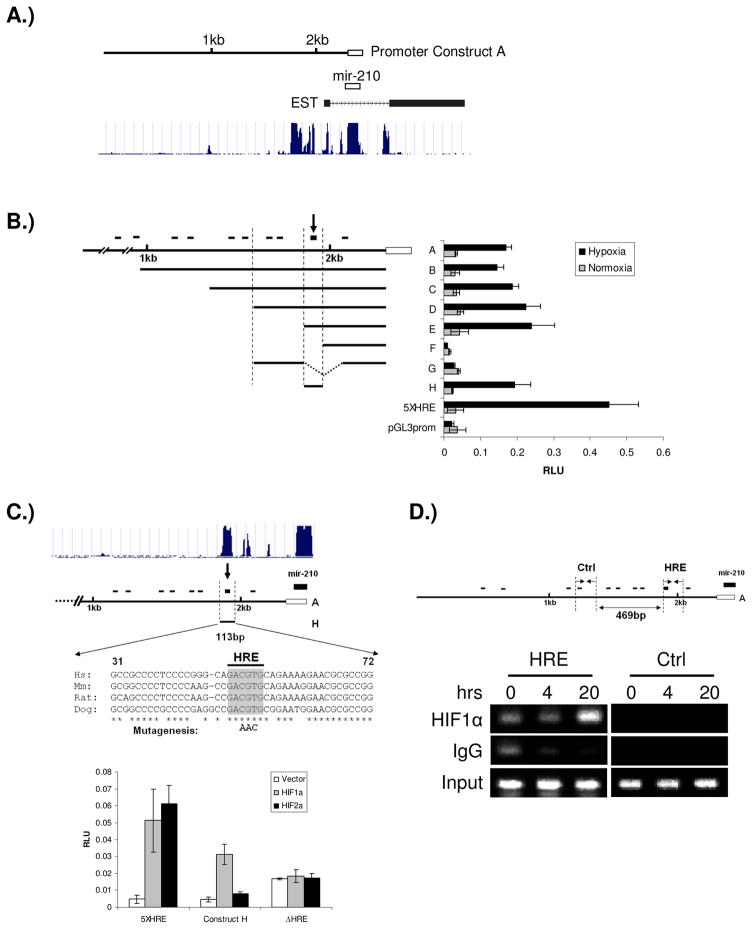
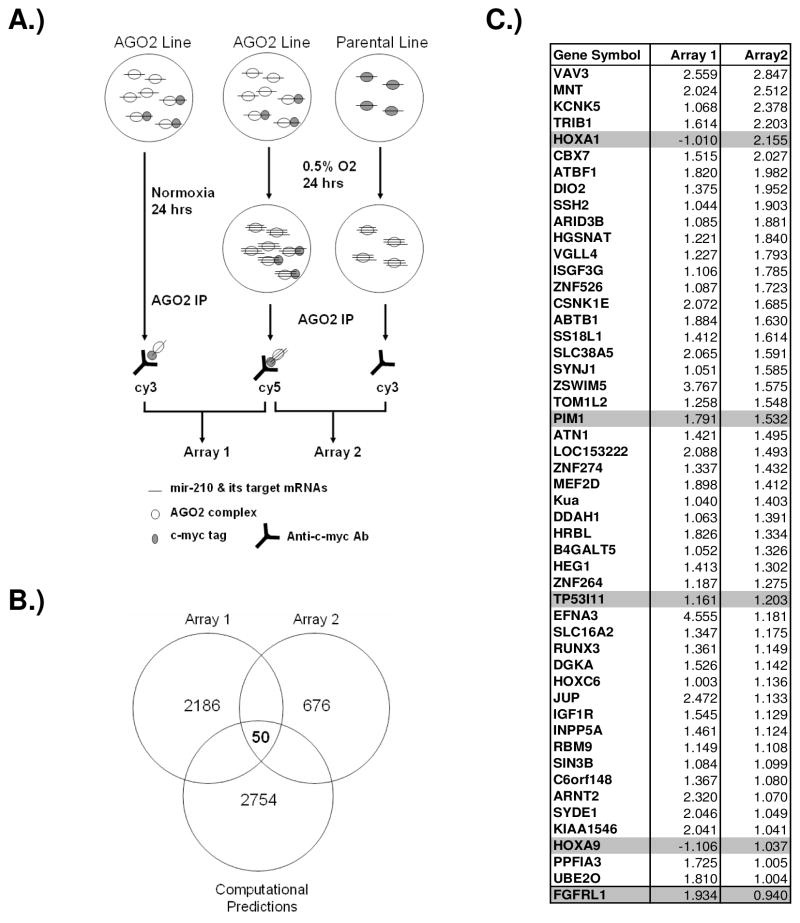
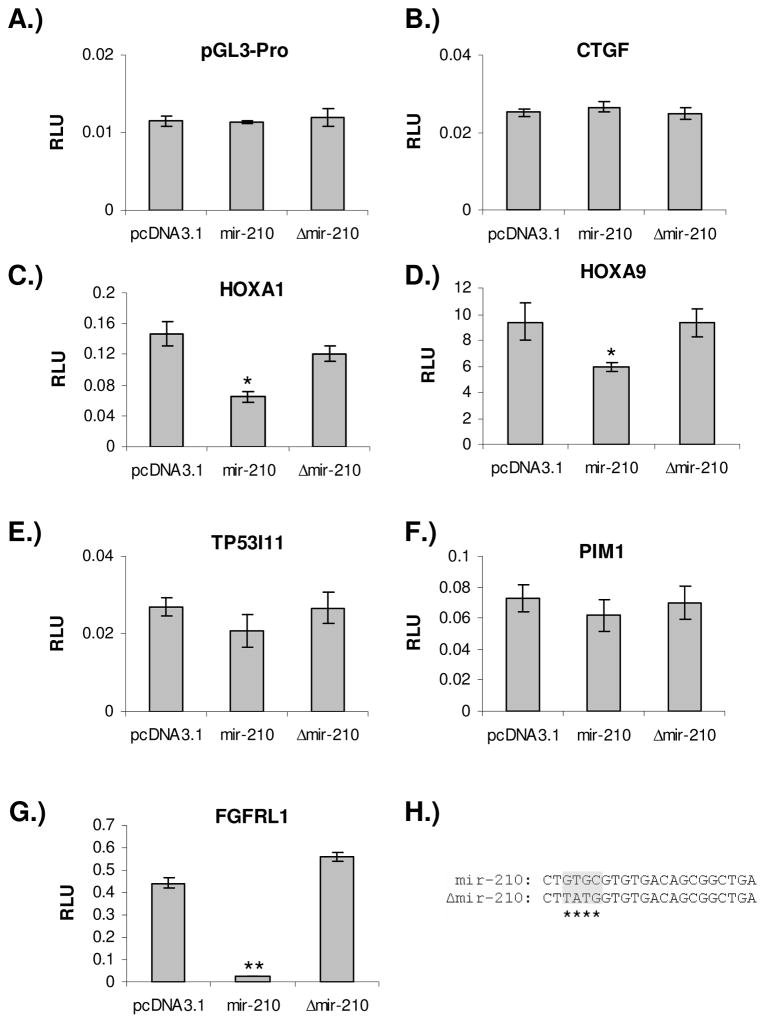
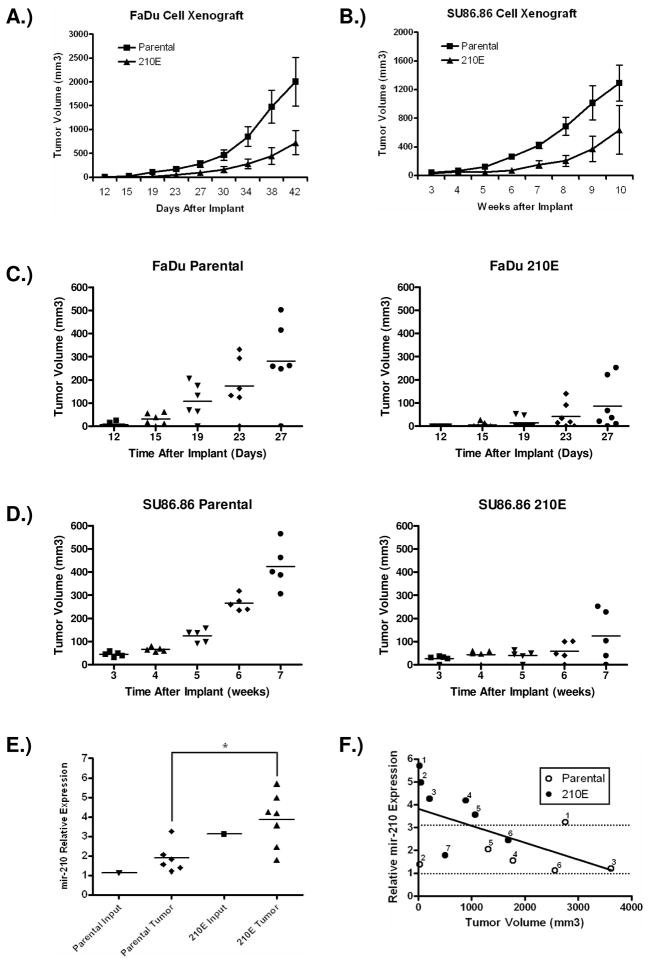
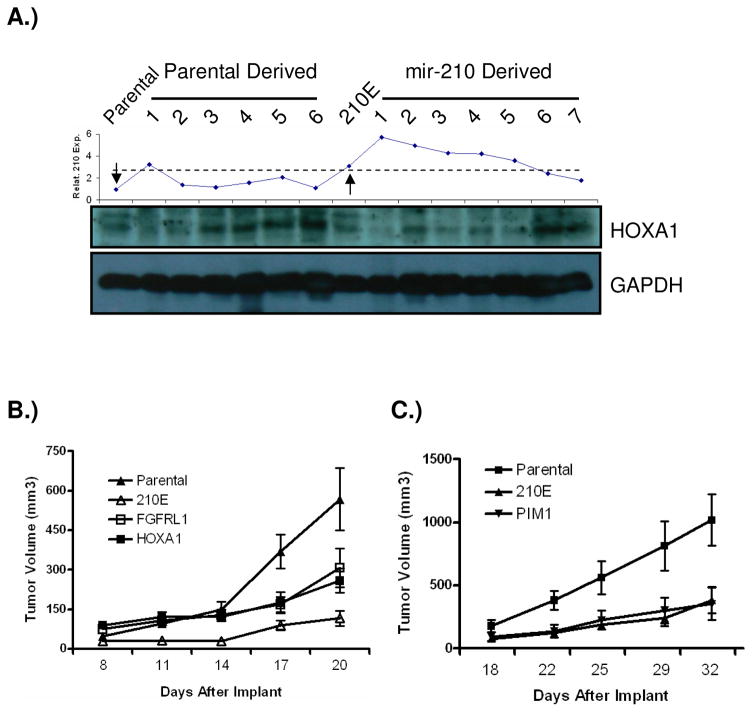
Previous studies have suggested that the HIF transcription factors can both activate and inhibit gene expression. Here we show that HIF1 regulates the expression of mir-210 in a variety of tumor types through a hypoxia-responsive element. Expression analysis in primary head and neck tumor samples indicates that mir-210 may serve as an in vivo marker for tumor hypoxia. By Argonaute protein immunoprecipitation, we identified 50 potential mir-210 targets and validated randomly selected ones. The majority of these 50 genes are not classical hypoxia-inducible genes, suggesting mir-210 represses genes expressed under normoxia that are no longer necessary to adapt and survive in a hypoxic environment. When human head and neck or pancreatic tumor cells ectopically expressing mir-210 were implanted into immunodeficient mice, mir-210 repressed initiation of tumor growth. Taken together, these data implicate an important role for mir-210 in regulating the hypoxic response of tumor cells and tumor growth.


Figures

Figure 1
Figure 1
Mir-210 is the predominant hypoxia-responsive miRNA. A) Microarray analysis of miRNAs induced during the cellular response to hypoxia. SU86.86 and SU86.86/shHIF1α cells were split into two plates 24 hours before the hypoxic treatment, respectively. One plate stayed in normoxia and the other was exposed to 2% O2 for 16 hours. Then RNAs were harvested at the same time and used to conduct microarray analysis. Data are presented on a scatter plot showing log10-transformed signal intensities for each probe on both channels for the Cy3-labeled normoxic control and for the Cy5-labeled hypoxic sample (top panel). In the parallel dye swap experiment, normoxic sample was labeled with cy5 and hypoxic sample was labeled with cy3 (bottom panel). mir-210 is identified as the most robustly induced miRNA and its induction is dependent on HIF1α. B) Western blot confirms efficient HIF1α knock-down by the shRNA construct in SU86.86 cells used in the microarray experiment; C) mir-210 is induced under different hypoxic stringencies by Northern blot. SU86.86 cells were split into four plates 24 hours before treatment. Then each plate was exposed to normoxia, 2%, 0.5%, or < 0.02% (anoxia) O2 for 24 hours. Small nuclear RNA U6 was used as a loading control; D) The kinetics of mir-210 induction under 2% O2 in SU86.86 cells. mir-210 expression reaches the plateau after 24 hours of hypoxia and stayed high till 48 hours (top panel), which is consistent with the control, GLUT1, a classic HIF regulated gene (middle panel). Western blot of HIF1α was shown to indicate hypoxia condition (bottom panel).
Figure 2
Figure 2
Mir-210 is broadly expressed and is a HIF1α-specific gene. A) Up-regulation of mir-210 by hypoxia is detected in all six different tumor types examined. Each cell line was split into two identical plates 24 hours prior to treatment. One was exposed to 2% O2 for 24 hours while the other was kept under normoxia and then, RNAs were harvested at the same time and used for Northern blotting. RCC4/VHL and 786/VHL are RCC4 and 786-O cell lines with stably reconstituted wild-type VHL gene. mir-210 is well induced by hypoxia in almost all cell lines examined, with highest induction in HSC3, MCF10A, and MCF7 cells. However, up-regulation by hypoxia is barely seen in MDA231, SQB20, and 786-O cells. U6 RNA was used as a loading control; B) Western blot of HIF1α and HIF2α in MDA-MB-231 and paired RCC4, 786-O cells. No HIF1α could be detected in 786-O and MDA-231 cells under 2% O2 for 24 hr. However, HIF2α could be readily detected in all cell lines. C) mir-210 expression was assayed by qPCR in RNAs harvested from RCC4/VHL cells with siRNA knock-down of HIF1α, HIF2α, or a scramble control siRNA with or without exposing to 2% O2 for 24 hours (lower panel). RNA input was normalized on small nuclear RNA RNU48. Upper panel shows the hypoxia induction and siRNA knock-down of HIF1α and HIF2α in these cells.
Figure 3
Figure 3
Identification of the functional HRE in mir-210 promoter. A) The schematic view of mir-210 genomic structure. The location of the cloned promoter related to mir-210 coding region was shown in top panel. Open box indicates the coding region of mir-210 and solid line indicates the 2.3kb promoter cloned. The conservation of mir-210 genomic sequences across species was shown in the bottom panel, which is from the UCSC database (http://genome.ucsc.edu). B) mir-210 promoter analysis. Promoter fragments were cloned into the pGL3-Basic vector; a 5XHRE construct, including five copies of the human VEGF HRE, serves as a positive control. Serial deletion constructs (identified by the letters A–H in the middle of the figure) are schematically represented in the bar diagram on the left, while their relative promoter activities in normoxia (gray bars) and 2% oxygen (black bars) are displayed on the right of the figure. The small black bars on the top represent the relative location of the ten potential HREs. The arrow at the top of the bar diagram indicates this HRE is essential for up-regulation of promoter activity under hypoxia. The open box represents mir-210 coding sequence; C) Mutation of the HRE sequence abolishes mir-210 promoter’s responsiveness to HIF1α. Constructs A and H are shown. Upper panel shows that the sequence surrounding the HRE site is the only region highly conserved across species in mir-210 promoter according to the UCSC database. The conserved nucleotides from 31–72 in construct H are indicated by asterisks. Three nucleotide mutations in the core of the HRE are in bold letters. Luciferase assays of construct H with/without HRE mutation are shown in the lower panel. Error bars indicate standard deviation. D) ChIP analysis of the mir-210 promoter. Upper panel, the relative locations of ChIP primers on mir-210 promoter. Lower panel, ChIP results. HSC3 cells were cultured under normoxia or 0.5% oxygen for 4 and 20 hours, respectively. PCR was performed with primers specific to the functional mir-210 HRE (HRE) and a region that is ~500bp upstream of the HRE site serving as a control (Ctrl). IgG refers to samples derived for the IP-negative control, HIF1α refers to DNA immunoprecipitated with a HIF1α antibody, and Input refers to the DNA derived from samples prior to immunoprecipitation.
Figure 4
Figure 4
Identification of mir-210 target genes by miRNP-IP. A) A schematic view of the strategy to identify mir-210 targets. B) Venn diagram shows potential mir-210 target genes predicted by four computational programs, TargetSacn, PicTar, miRanda, and PITA and genes enriched in miRNP-IP experiments. C) Fifty potential mir-210 target genes were identified. The four genes used in validation were highlighted in gray. The FGFRL1 gene with a little less than 2-fold enrichment in array 2 was also included at the bottom of the list. The values shown are normalized log2(R/G).
Figure 5
Figure 5
Validation of randomly selected mir-210 target genes identified by miRNP-IP. A) pGL3-promoter vector and B) CTGF 3′ UTR construct were used as negative controls. They are not responsive to expression of either wild type or mutant mir-210. C-G) Reporter luciferase activity are repressed or relieved by co-transfecting mir-210 wild type or mutant expression vector with HOXA1, HOXA9, TP53I11, PIM1, and FGFRL1 3′ UTR constructs. H) The mutations in mir-210 expression construct. The four-nucleotide mutation was introduced in the seed region of mir-210. Each reporter assay was repeated at least three times. Error bar indicates standard deviation. Student’s t-test was performed for statistical analysis, ** p< 0.001, * p<0.05.
Figure 6
Figure 6
Mir-210 represses tumor growth in a mouse xenograft model. A) FaDu cells with ectopic expression of mir-210 and parental cells were injected s.c in nude mice at a density of 106 cells. N=6 for parental group and N=7 for 210E group. B) SU86.86 cells with ectopic expression of mir-210 and parental cells were injected s.c in nude mice at a density of 107 cells. N=5 for the each group. Tumor volumes are represented as average ± SEM. C) Tumor growth in the first four weeks of FaDu cell xenograft implants. D) Tumor growth in the first seven weeks of SU86.86 cell xenograft implants. Left panel, cells without ectopic mir-210 expression; right panel, cells with ectopic mir-210 expression. E) Expression of mir-210 was measured by TaqMan RT-PCR from xenograft tumor samples with/without ectopic expression of mir-210. Expression of mir-210 was also measured from the same tumor cells left after tumor injection. RNA input was normalized on small nuclear RNA RNU48. There is a significant difference of mir-210 expression between the parental and 210E groups (student’s t-test, p=0.025). F) Negative correlation between the size of xenograft tumors and corresponding mir-210 expression level. The bottom and top dotted lines indicate mir-210 expression level in parental cells and in cells ectopically expressing mir-210, respectively.
Figure 7
Figure 7
HOXA1 is regulated by mir-210 in vivo. A) HOXA1 protein in harvested tumor xenograft samples. Top panel, mir-210 expression in each sample; bottom panel, HOXA1 protein level in corresponding samples. The left and right arrows in the top panel indicate the input parental and input mir-210 expressing cells, respectively. Dotted line indicates two groups of samples with inversed profiles of mir-210 expression and HOXA1 protein level. B) The inhibitory effect of mir-210 on tumor growth initiation was partially rescued by expressing HOXA1 or FGFRL1 coding sequence without a 3′ UTR region. Each group of FaDu cells was injected s.c in nude mice at a density of 2.5x10⁶ cells. N=7 for the each group. C) Expressing PIM1 coding sequence without a 3′ UTR region has no effect on the inhibitory effect of mir-210 on tumor growth initiation. Each group of FaDu cells was injected s.c in nude mice at a density of 3x10⁶ cells. N=7 for the each group.

Comment in

Similar articles

Cited by

References

    1. Baek D, Villen J, Shin C, Camargo FD, Gygi SP, Bartel DP. The impact of microRNAs on protein output. Nature. 2008;455:64–71. - PMC - PubMed
    1. Bartel DP. MicroRNAs: Genomics, Biogenesis, Mechanism, and Function. Cell. 2004;116:281–297. - PubMed
    1. Beitzinger M, Peters L, Zhu JY, Kremmer E, Meister G. Identification of human microRNA targets from isolated argonaute protein complexes. RNA Biology. 2007;4:76–84. - PubMed
    1. Camps C, Buffa FM, Colella S, Moore J, Sotiriou C, Sheldon H, Harris AL, Gleadle JM, Ragoussis J. hsa-miR-210 Is Induced by Hypoxia and Is an Independent Prognostic Factor in Breast Cancer. Clin Cancer Res. 2008;14:1340–1348. - PubMed
    1. Carmeliet P, Dor Y, Herbert JM, Fukumura D, Brusselmans K, Dewerchin M, Neeman M, Bono F, Abramovitch R, Maxwell P, et al. Role of HIF- 1[alpha] in hypoxia-mediated apoptosis, cell proliferation and tumour angiogenesis. Nature. 1998;394:485–490. - PubMed

Publication types

MeSH terms