. 2009 Nov 27;394(2):183-96.
doi: 10.1016/j.jmb.2009.09.006. Epub 2009 Sep 8.

RelB and RelE of Escherichia coli form a tight complex that represses transcription via the ribbon-helix-helix motif in RelB

Affiliations

RelB and RelE of Escherichia coli form a tight complex that represses transcription via the ribbon-helix-helix motif in RelB

Martin Overgaard et al. J Mol Biol. .

Abstract

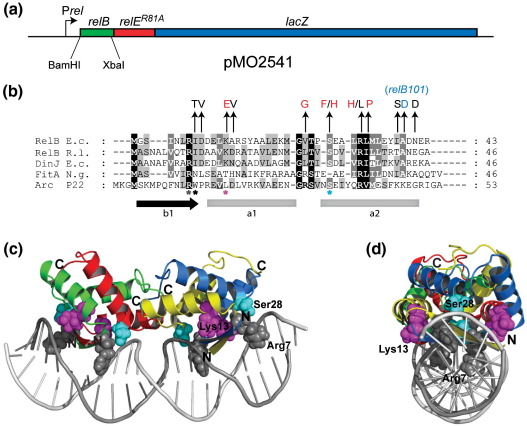
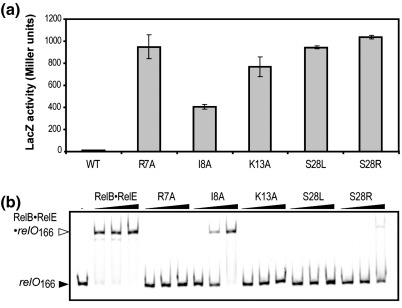
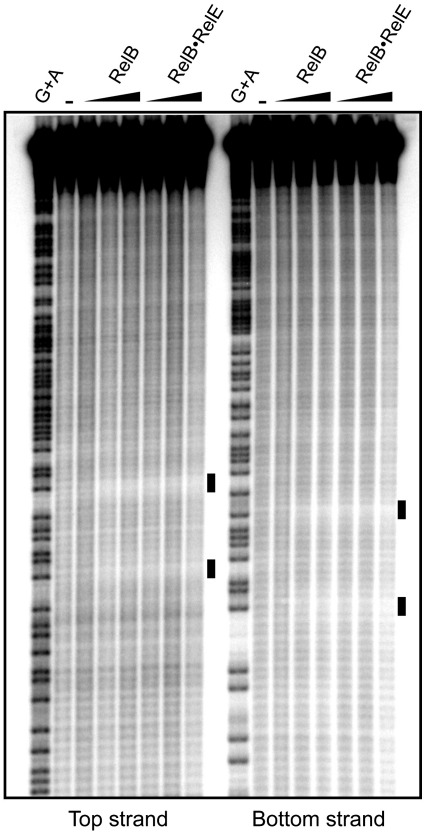
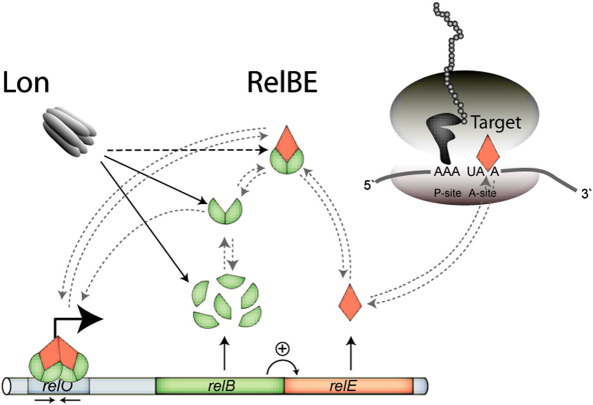
RelB, the ribbon-helix-helix (RHH) repressor encoded by the relBE toxin-antitoxin locus of Escherichia coli, interacts with RelE and thereby counteracts the mRNA cleavage activity of RelE. In addition, RelB dimers repress the strong relBE promoter and this repression by RelB is enhanced by RelE; that is, RelE functions as a transcriptional co-repressor. RelB is a Lon protease substrate, and Lon is required both for activation of relBE transcription and for activation of the mRNA cleavage activity of RelE. Here we characterize the molecular interactions important for transcriptional control of the relBE model operon. Using an in vivo screen for relB mutants, we identified multiple nucleotide changes that map to important amino acid positions within the DNA-binding domain formed by the N-terminal RHH motif of RelB. Analysis of DNA binding of a subset of these mutant RHH proteins by gel-shift assays, transcriptional fusion assays and a structure model of RelB-DNA revealed amino acid residues making crucial DNA-backbone contacts within the operator (relO) DNA. Mutational and footprinting analyses of relO showed that RelB dimers bind on the same face of the DNA helix and that the RHH motif recognizes four 6-bp repeats within the bipartite binding site. The spacing between each half-site was found to be essential for cooperative interactions between adjacently bound RelB dimers stabilized by the co-repressor RelE. Kinetic and stoichiometric measurements of the interaction between RelB and RelE confirmed that the proteins form a high-affinity complex with a 2:1 stoichiometry. Lon degraded RelB in vitro and degradation was inhibited by RelE, consistent with the proposal that RelE protects RelB from proteolysis by Lon in vivo.


Figures

Fig. 1
Fig. 1
RelB mutants defective in transcriptional autoregulation. (a) Schematic of pMO2541 carrying a translational relBER81A::lacZ fusion used to insert mutagenic PCR fragments of relB in order to screen for derepressed (blue) mutant colonies on X-gal indicator plates. (b) Multiple alignment of the RHH motifs of RelB, E. coli; RelB, R. leguminosarum; RelB2 (DinJ), E. coli; FitA, N. gonorrhoeae; and Arc, bacteriophage P22. Residues are marked by decreasing conservation: white text on black boxes; white text on dark grey boxes and black text on grey boxes. Vertical arrows indicate the amino acid substitutions that were found in the RelB RHH variants obtained in the screen. Amino acids shown in black were obtained in combination with one of the other mutations, whereas amino acids colored in red were obtained independently in each clone. The aspartate colored in blue is encoded by the previously described relB101 allele. Amino acids in the alignment marked by asterisks were selected for further mutant characterization in Fig. 2 and are color coded according to representations in (c) and (d). The location of the RHH secondary structure in RelB is depicted by a black arrow and grey boxes, respectively. (c) Side view of a structure model of the RelB–DNA complex based on the NMR structure of RelB1–50 (PDB ID 2k29) and the crystal structure of the Arc–DNA complex (PDB ID 1bdt). Two RelB1–50 dimers were modeled on a 22-nucleotide double-stranded fragment representing Arc operator DNA. RelB1–50 monomers of each dimer are colored green and red or yellow and blue, respectively. Side chains of the conserved R7 amino acid (grey spheres) from the β-strand of each subunit make sequence-specific base interactions in DNA major grooves. Side chains of the conserved S28 (cyan spheres) from the N-terminal part of helix α2 make unspecific DNA sugar–phosphate backbone interactions. Side chains of K13 (magenta spheres) from the N-terminal part of helix α1 make putative electrostatic DNA sugar–phosphate backbone interactions. (d) Side view of (c) by 90° rotation along the y-axis. The representations were prepared in PyMOL.
Fig. 2
Fig. 2
In vivo and in vitro characterization of amino acid changes in the RHH motif of RelB. (a) Autoregulation of relBE RHH mutants. Strains carrying plasmid derivatives of the low-copy-number R1 transcriptional fusion relBER81A::lacZ vector, pMGJ4004, with the relB mutations indicated, were grown exponentially in LB medium and subjected to β-galactosidase assay. Each value represents the mean of at least three independent experiments. Error bars represent standard deviation of the mean. (b) Gel-shift analysis of RelB2·RelE repression complexes carrying substitutions in the DNA-binding RHH domain of RelB. A Cy5-labeled PCR fragment (relO166) was incubated in the absence (−) or presence of increasing concentrations (0.05, 0.25 and 1.25 μM) of either WT RelB2·RelE complex or the mutant derivatives as indicated and subjected to native PAGE and subsequent fluorescent scanning.
Fig. 3
Fig. 3
Scanning mutagenesis of relO. A series of dinucleotide substitutions (relO1 to relO12), single base substitutions (relO13 and relO14) and insertions (relO15 and relO16) were introduced into pMGJ4004 and the resulting plasmids were transformed into strain MG1 (ΔrelBEF::aphA) and cultures were grown exponentially in LB medium and subjected to β-galactosidase assay. Each value represents the mean of at least three independent experiments normalized to the LacZ β-galactosidase activity of the unrepressed mutant promoter relative to the corresponding WT promoter. Error bars represent standard deviation of the mean. A double-stranded representation of relO is given at the bottom of the figure. The hexad repeats of each operator half-site are boxed in red and blue, respectively, and protected positions obtained in Fig. 4 are marked by black bars.
Fig. 4
Fig. 4
Hydroxyl radical footprinting of relO166. PCR fragments of relO166, P-end-labeled at the top and bottom strands, respectively, were incubated in the absence (−) or presence of increasing concentrations (0.1, 0.5 and 2.5 μM) of RelB2 or RelB2·RelE complex and subjected to hydroxyl radical footprinting. A ladder of G+A of each DNA fragment was included next to the footprinting reactions. Black bars indicate DNA sugar–backbone protected positions along relO, which are also indicated in Fig. 3.
Fig. 5
Fig. 5
Kinetic and stoichiometric measurements of RelB and RelE interactions. (a) SPR kinetic analysis. Forty resonance units (RU) of RelB-Cys was immobilized on a CM5 sensor chip and assayed for concentration-dependent RelE binding. Increasing concentrations of RelE were injected in separate association/dissociation/regeneration cycles performed in duplicate for each concentration used. The reference-subtracted response difference in resonance units (RU) for each concentration used is shown in the sensorgram. RelE concentrations from top to bottom: 100, 50, 25, 12.5 and 0 nM. Dashed lines indicate fitted values used to obtain the rate constants (see the text). (b) Tryptophan fluorescence analysis of the RelB–RelE interaction. Complex formation was monitored by stoichiometric titration of RelE (0.35 μM) with RelB. RelE tryptophans were excited at 295 nm, and the emission signal was monitored from 315 to 400 nm. The maxima values at approximately 330 nm are represented as fractional change. Each point represents the average of four measurements. Error bars represents the standard deviation.
Fig. 6
Fig. 6
RelB is degraded by Lon protease. (a and b) SPR analysis. RelB-Cys was immobilized on a CM5 sensor chip and Lon was injected at a concentration of 200 nM with (red sensorgram) or without (blue sensorgram) MgCl2 (8 mM) and ATP (2 mM) in the buffer as indicated by arrows in the figure. At time ∼ 450 s, the dissociation phase was initiated with (red sensorgram) or without (blue line) MgCl2 and ATP in the buffer. Finally, a second dissociation phase at time ∼ 550 s was initiated by changing to buffer without MgCl2 and ATP (red sensorgram only). For kinetic measurements, the following Lon concentrations were used: from top to bottom, 100, 50 nM, 25 nM, 12.5 and 0 nM. (c) In vitro degradation of HMK-RelB. Lon and 32P[HMK-RelB] were incubated at 37 °C for 120 min (lanes 1–5) or the times indicated (lanes 6–12) in reaction buffer with or without the components specified and subjected to SDS-PAGE and phosphoimaging. In control reactions (lanes 1 and 6) Lon was omitted.
Fig. 7
Fig. 7
Model explaining regulation of the relBE locus. The relBE operon has a typical TA organization. The first gene encodes the RelB antitoxin (green) and the second gene encodes mRNA interferase and co-repressor RelE (red). RelB is produced in ∼ 10 fold excess of RelE due to coupled translation (bent arrow, +). RelB monomers readily form dimers via their N-terminal RHH domain and interact with RelE monomers to form a tight nontoxic complex. During exponential growth, RelE is exclusively bound by RelB. This complex forms a heterohexamer when bound to relO, which involves cooperativity mediated by co-repressor RelE. The repression complex bound to its operator overlapping the − 10 box in the promoter region prevents transcription initiation of RNA polymerase and results in a low level of relBE expression. In steady-state and upon stress induced growth arrest, the ATP-dependent protease Lon degrades RelB at a high rate. Lon degrades RelB in its free states and in complex with RelE. A reduction in the global rate of translation as a consequence of stress shifts the RelE equilibrium toward free RelE as the level of RelB declines. This shift in the ratio between RelB and RelE results in derepression of the promoter due to loss of cooperativity in the repression complex. Increased transcription may contribute to a decrease in the RelB/RelE ratio in concert with enhanced activity of Lon. As a result RelE is free to act on its target, the ribosomal A-site, to promote codon-specific cleavage of mRNA. This in turn reduces energy consumption in the cell and may yield a lower level of translation errors.

Similar articles

Cited by

References

    1. Gerdes K., Christensen S.K., Lobner-Olesen A. Prokaryotic toxin–antitoxin stress response loci. Nat. Rev. Microbiol. 2005;3:371–382. - PubMed
    1. Christensen S.K., Mikkelsen M., Pedersen K., Gerdes K. RelE, a global inhibitor of translation, is activated during nutritional stress. Proc. Natl Acad. Sci. USA. 2001;98:14328–14333. - PMC - PubMed
    1. Van Melderen L., Bernard P., Couturier M. Lon-dependent proteolysis of CcdA is the key control for activation of CcdB in plasmid-free segregant bacteria. Mol. Microbiol. 1994;11:1151–1157. - PubMed
    1. Kamada K., Hanaoka F. Conformational change in the catalytic site of the ribonuclease YoeB toxin by YefM antitoxin. Mol. Cell. 2005;19:497–509. - PubMed
    1. Pedersen K., Zavialov A.V., Pavlov M.Y., Elf J., Gerdes K., Ehrenberg M. The bacterial toxin RelE displays codon-specific cleavage of mRNAs in the ribosomal A site. Cell. 2003;112:131–140. - PubMed

Publication types

MeSH terms

LinkOut - more resources