KLF2 transcription-factor deficiency in T cells results in unrestrained cytokine production and upregulation of bystander chemokine receptors
- PMID: 19592277
- PMCID: PMC2724594
- DOI: 10.1016/j.immuni.2009.05.011
KLF2 transcription-factor deficiency in T cells results in unrestrained cytokine production and upregulation of bystander chemokine receptors
Abstract
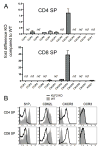
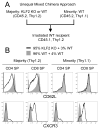
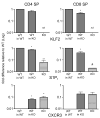
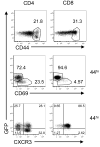
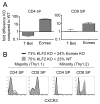
The transcription factor KLF2 regulates T cell trafficking by promoting expression of the lipid-binding receptor S1P(1) and the selectin CD62L. Recently, it was proposed that KLF2 also represses the expression of chemokine receptors. We confirmed the upregulation of the chemokine receptor CXCR3 on KLF2-deficient T cells. However, we showed that this was a cell-nonautonomous effect, as revealed by CXCR3 upregulation on wild-type bystander cells in mixed bone-marrow chimeras with KLF2-deficient cells. Furthermore, KLF2-deficient T cells overproduced IL-4, leading to the upregulation of CXCR3 through an IL-4-receptor- and eomesodermin-dependent pathway. Consistent with the increased IL-4 production, we found high concentrations of serum IgE in mice with T cell-specific KLF2 deficiency. Our findings support a model where KLF2 regulates T cell trafficking by direct regulation of S1P(1) and CD62L and restrains spontaneous cytokine production in naive T cells.
Figures


Comment in
-
How to be naive.Immunity. 2009 Jul 17;31(1):9-11. doi: 10.1016/j.immuni.2009.06.010. Immunity. 2009. PMID: 19604488
Similar articles
-
Kruppel-like factor 2 controls T cell trafficking by activating L-selectin (CD62L) and sphingosine-1-phosphate receptor 1 transcription.J Immunol. 2007 Jun 15;178(12):7632-9. doi: 10.4049/jimmunol.178.12.7632. J Immunol. 2007. PMID: 17548599
-
ERK5 regulation in naïve T-cell activation and survival.Eur J Immunol. 2008 Sep;38(9):2534-47. doi: 10.1002/eji.200737867. Eur J Immunol. 2008. PMID: 18792406
-
The transcription factor KLF2 restrains CD4⁺ T follicular helper cell differentiation.Immunity. 2015 Feb 17;42(2):252-264. doi: 10.1016/j.immuni.2015.01.013. Immunity. 2015. PMID: 25692701 Free PMC article.
-
Kruppel-like factor 2 is required for trafficking but not quiescence in postactivated T cells.J Immunol. 2011 Jan 15;186(2):775-83. doi: 10.4049/jimmunol.1000094. Epub 2010 Dec 15. J Immunol. 2011. PMID: 21160050 Free PMC article.
-
Krüppel-like Factor 2 (KLF2) in Immune Cell Migration.Vaccines (Basel). 2021 Oct 13;9(10):1171. doi: 10.3390/vaccines9101171. Vaccines (Basel). 2021. PMID: 34696279 Free PMC article. Review.
Cited by
-
PTPN2 Deficiency Enhances Programmed T Cell Expansion and Survival Capacity of Activated T Cells.Cell Rep. 2020 Jul 28;32(4):107957. doi: 10.1016/j.celrep.2020.107957. Cell Rep. 2020. PMID: 32726622 Free PMC article.
-
Multicytokine-producing CD4+ T cells characterize the livers of patients with NASH.JCI Insight. 2023 Jan 10;8(1):e153831. doi: 10.1172/jci.insight.153831. JCI Insight. 2023. PMID: 36625344 Free PMC article.
-
Phenotypic plasticity of malignant T cells in blood and skin of a Sézary syndrome patient revealed by single cell transcriptomics.Front Oncol. 2023 Jan 25;13:1090592. doi: 10.3389/fonc.2023.1090592. eCollection 2023. Front Oncol. 2023. PMID: 36761972 Free PMC article.
-
JMJD3 regulates CD4 T cell trafficking by targeting actin cytoskeleton regulatory gene Pdlim4.J Clin Invest. 2019 Aug 8;129(11):4745-4757. doi: 10.1172/JCI128293. J Clin Invest. 2019. PMID: 31393857 Free PMC article.
-
Interleukin-4 regulates eomesodermin in CD8+ T cell development and differentiation.PLoS One. 2014 Sep 10;9(9):e106659. doi: 10.1371/journal.pone.0106659. eCollection 2014. PLoS One. 2014. PMID: 25207963 Free PMC article.
References
-
- Allende ML, Dreier JL, Mandala S, Proia RL. Expression of the sphingosine 1-phosphate receptor, S1P1, on T-cells controls thymic emigration. J Biol Chem. 2004;279:15396–15401. - PubMed
-
- Ansel KM, Djuretic I, Tanasa B, Rao A. Regulation of Th2 differentiation and Il4 locus accessibility. Annu Rev Immunol. 2006;24:607–656. - PubMed
-
- Apfeld J, Kenyon C. Cell nonautonomy of C. elegans daf-2 function in the regulation of diapause and life span. Cell. 1998;95:199–210. - PubMed
-
- Arbones ML, Ord DC, Ley K, Ratech H, Maynard-Curry C, Otten G, Capon DJ, Tedder TF. Lymphocyte homing and leukocyte rolling and migration are impaired in L-selectin-deficient mice. Immunity. 1994;1:247–260. - PubMed
-
- Bai A, Hu H, Yeung M, Chen J. Kruppel-Like Factor 2 Controls T Cell Trafficking by Activating L-Selectin (CD62L) and Sphingosine-1-Phosphate Receptor 1 Transcription. J Immunol. 2007;178:7632–7639. - PubMed
Publication types
MeSH terms
Substances
Grants and funding
- R01-AI38903/AI/NIAID NIH HHS/United States
- T32 AI007313/AI/NIAID NIH HHS/United States
- R01 AI076458-02/AI/NIAID NIH HHS/United States
- T32-AI007313/AI/NIAID NIH HHS/United States
- R01 AI042370/AI/NIAID NIH HHS/United States
- R01 AI038903/AI/NIAID NIH HHS/United States
- R01 AI039560/AI/NIAID NIH HHS/United States
- R01 AI039560-06/AI/NIAID NIH HHS/United States
- R01-AI39560/AI/NIAID NIH HHS/United States
- T32 AI007313-21/AI/NIAID NIH HHS/United States
- R01 AI042370-12/AI/NIAID NIH HHS/United States
- R01 AI038903-10/AI/NIAID NIH HHS/United States
- R01 AI076458/AI/NIAID NIH HHS/United States
- R37 AI038903/AI/NIAID NIH HHS/United States
LinkOut - more resources
Full Text Sources
Other Literature Sources
Molecular Biology Databases
Research Materials

