

Multi-site assessment of the precision and reproducibility of multiple reaction monitoring-based measurements of proteins in plasma
- PMID: 19561596
- PMCID: PMC2855883
- DOI: 10.1038/nbt.1546
Multi-site assessment of the precision and reproducibility of multiple reaction monitoring-based measurements of proteins in plasma
Erratum in
- Nat Biotechnol. 2009 Sep;27(9):864
Abstract
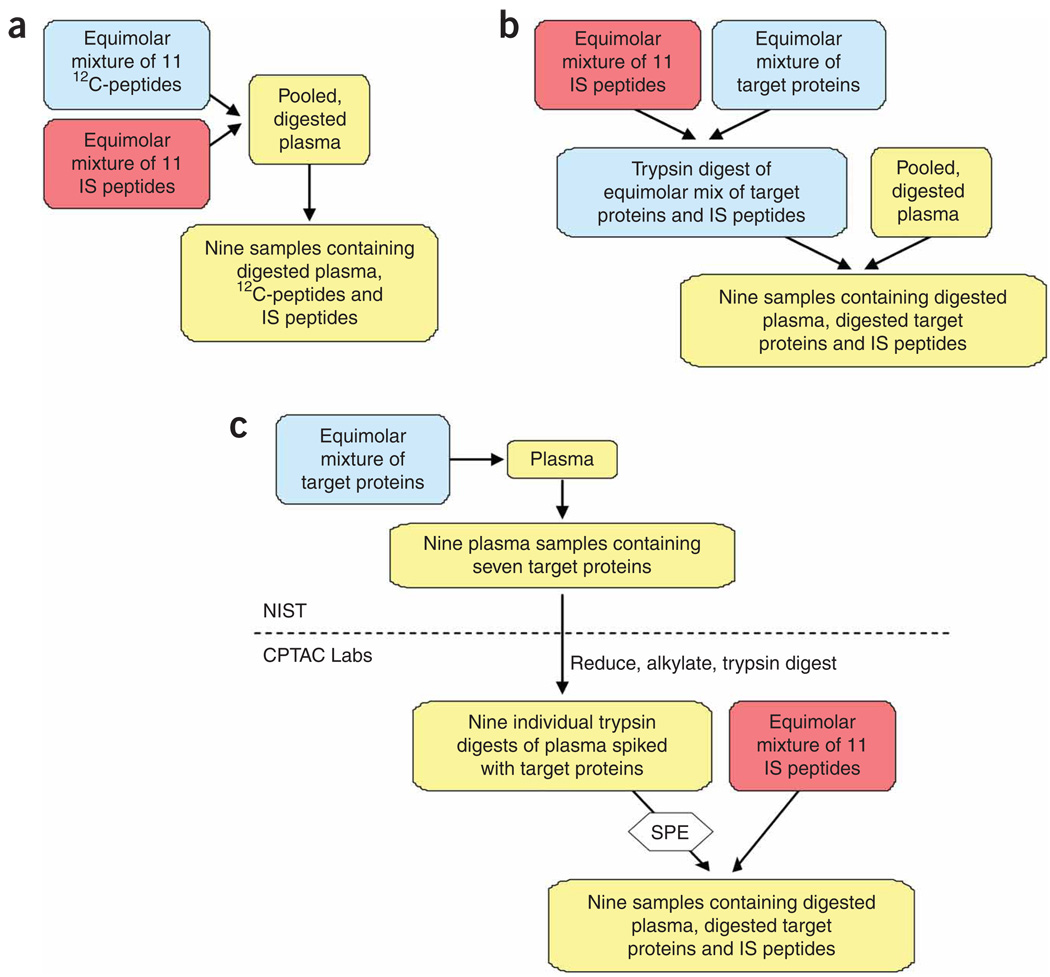
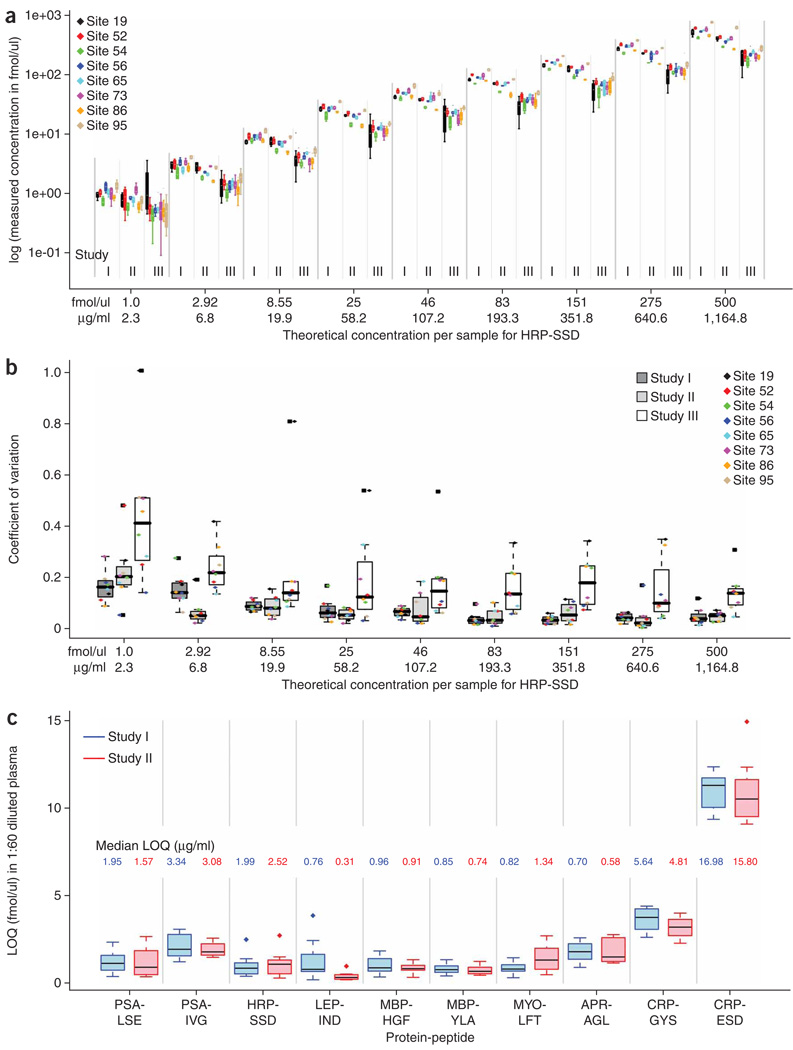
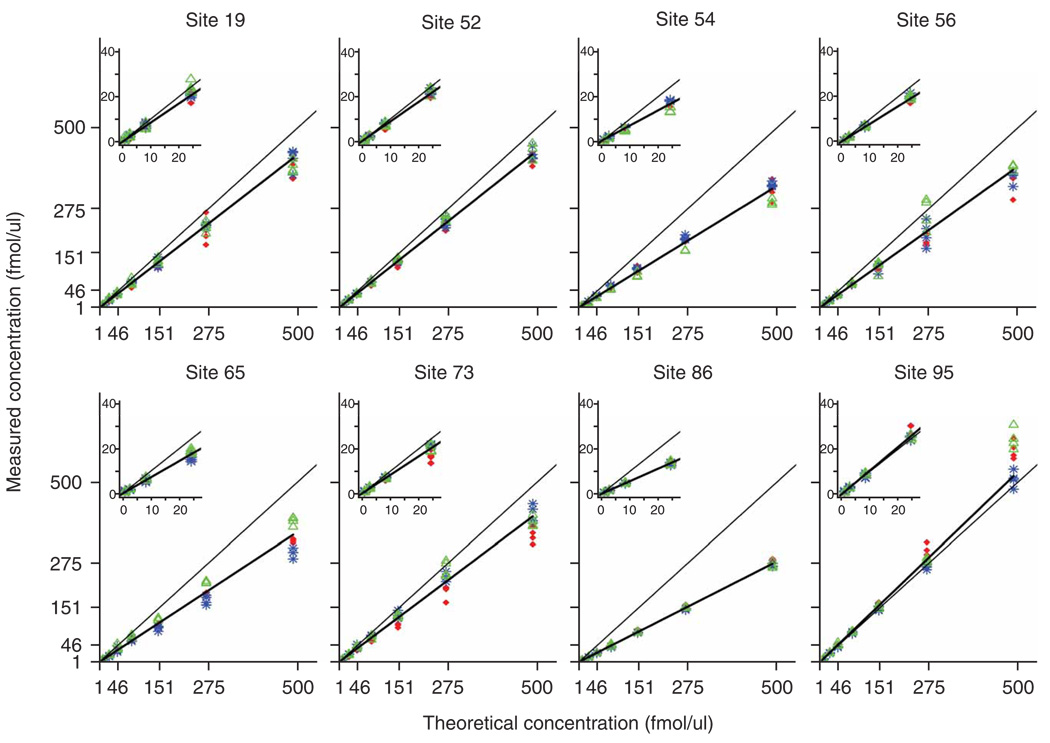
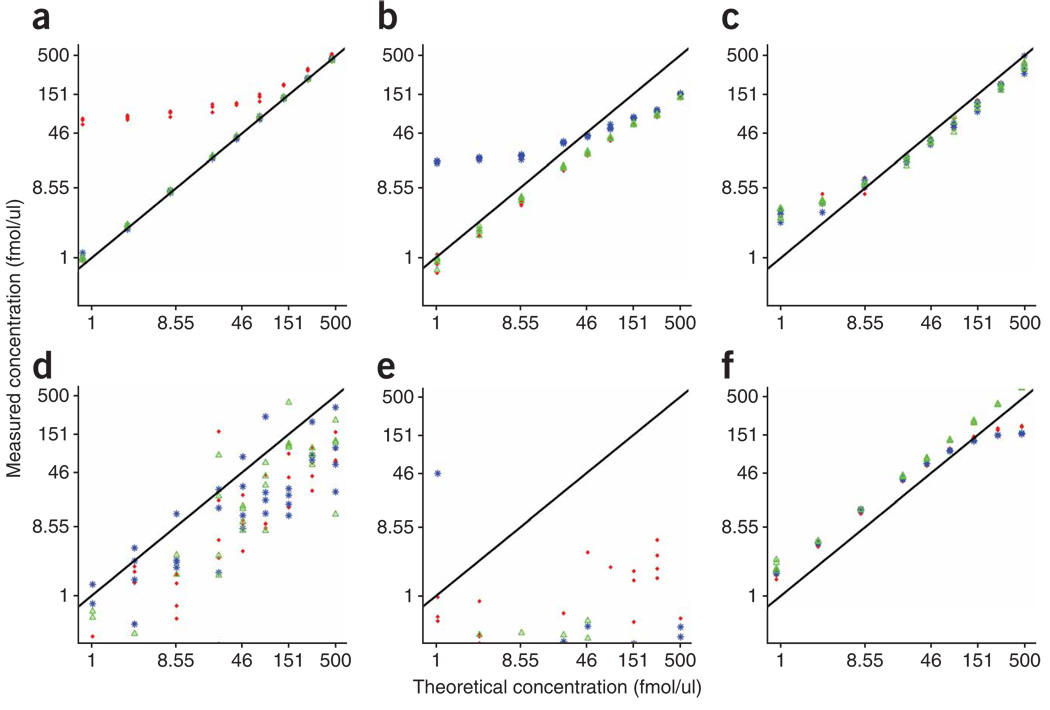
Verification of candidate biomarkers relies upon specific, quantitative assays optimized for selective detection of target proteins, and is increasingly viewed as a critical step in the discovery pipeline that bridges unbiased biomarker discovery to preclinical validation. Although individual laboratories have demonstrated that multiple reaction monitoring (MRM) coupled with isotope dilution mass spectrometry can quantify candidate protein biomarkers in plasma, reproducibility and transferability of these assays between laboratories have not been demonstrated. We describe a multilaboratory study to assess reproducibility, recovery, linear dynamic range and limits of detection and quantification of multiplexed, MRM-based assays, conducted by NCI-CPTAC. Using common materials and standardized protocols, we demonstrate that these assays can be highly reproducible within and across laboratories and instrument platforms, and are sensitive to low mug/ml protein concentrations in unfractionated plasma. We provide data and benchmarks against which individual laboratories can compare their performance and evaluate new technologies for biomarker verification in plasma.
Figures
Comment in
-
Biomarker validation by targeted mass spectrometry.Nat Biotechnol. 2009 Jul;27(7):622-3. doi: 10.1038/nbt0709-622. Nat Biotechnol. 2009. PMID: 19587666 No abstract available.
Similar articles
-
Rapid verification of candidate serological biomarkers using gel-based, label-free multiple reaction monitoring.J Proteome Res. 2011 Sep 2;10(9):4005-17. doi: 10.1021/pr2002098. Epub 2011 Jul 26. J Proteome Res. 2011. PMID: 21726088 Free PMC article.
-
Quantitative, multiplexed assays for low abundance proteins in plasma by targeted mass spectrometry and stable isotope dilution.Mol Cell Proteomics. 2007 Dec;6(12):2212-29. doi: 10.1074/mcp.M700354-MCP200. Epub 2007 Oct 15. Mol Cell Proteomics. 2007. PMID: 17939991 Free PMC article.
-
Large-Scale Interlaboratory Study to Develop, Analytically Validate and Apply Highly Multiplexed, Quantitative Peptide Assays to Measure Cancer-Relevant Proteins in Plasma.Mol Cell Proteomics. 2015 Sep;14(9):2357-74. doi: 10.1074/mcp.M114.047050. Epub 2015 Feb 18. Mol Cell Proteomics. 2015. PMID: 25693799 Free PMC article.
-
MRM for the verification of cancer biomarker proteins: recent applications to human plasma and serum.Expert Rev Proteomics. 2014 Apr;11(2):137-48. doi: 10.1586/14789450.2014.877346. Epub 2014 Jan 29. Expert Rev Proteomics. 2014. PMID: 24476379 Review.
-
Protocol for Standardizing High-to-Moderate Abundance Protein Biomarker Assessments Through an MRM-with-Standard-Peptides Quantitative Approach.Adv Exp Med Biol. 2016;919:515-530. doi: 10.1007/978-3-319-41448-5_24. Adv Exp Med Biol. 2016. PMID: 27975233 Review.
Cited by
-
Upregulation of Proinflammatory Bradykinin Peptides in Systemic Lupus Erythematosus and Rheumatoid Arthritis.J Immunol. 2020 Jul 15;205(2):369-376. doi: 10.4049/jimmunol.1801167. Epub 2020 Jun 15. J Immunol. 2020. PMID: 32540998 Free PMC article.
-
Discovery of new biomarkers for malignant mesothelioma.Curr Pulmonol Rep. 2015;4(1):15-21. doi: 10.1007/s13665-015-0106-8. Curr Pulmonol Rep. 2015. PMID: 25927434 Free PMC article. Review.
-
Clinical review: improving the measurement of serum thyroglobulin with mass spectrometry.J Clin Endocrinol Metab. 2013 Apr;98(4):1343-52. doi: 10.1210/jc.2012-4172. Epub 2013 Feb 28. J Clin Endocrinol Metab. 2013. PMID: 23450057 Free PMC article. Review.
-
From radioimmunoassay to mass spectrometry: a new method to quantify orexin-A (hypocretin-1) in cerebrospinal fluid.Sci Rep. 2016 May 11;6:25162. doi: 10.1038/srep25162. Sci Rep. 2016. PMID: 27165941 Free PMC article.
-
Precision of multiple reaction monitoring mass spectrometry analysis of formalin-fixed, paraffin-embedded tissue.J Proteome Res. 2012 Jun 1;11(6):3498-505. doi: 10.1021/pr300130t. Epub 2012 May 7. J Proteome Res. 2012. PMID: 22530795 Free PMC article.
References
-
- Rifai N, Gillette MA, Carr SA. Protein biomarker discovery and validation: the long and uncertain path to clinical utility. Nat. Biotechnol. 2006;24:971–983. - PubMed
-
- Barr JR, et al. Isotope-dilution mass spectrometric quantification of specific proteins: model application with apolipoprotein A-1. Clin. Chem. 1996;42:1676–1682. - PubMed
-
- Barnidge DR, et al. Absolute quantification of the G protein-coupled receptor rhodopsin by LC/MS/MS using proteolysis product peptides and synthetic peptide standards. Anal. Chem. 2003;75:445–451. - PubMed
Publication types
MeSH terms
Substances
Grants and funding
LinkOut - more resources
Full Text Sources
Other Literature Sources
Miscellaneous
