. 2009 Jun;5(6):e1000492.
doi: 10.1371/journal.ppat.1000492. Epub 2009 Jun 26.

Epstein-barr virus latency in B cells leads to epigenetic repression and CpG methylation of the tumour suppressor gene Bim

Affiliations

Epstein-barr virus latency in B cells leads to epigenetic repression and CpG methylation of the tumour suppressor gene Bim

Kostas Paschos et al. PLoS Pathog. 2009 Jun.

Abstract

In human B cells infected with Epstein-Barr virus (EBV), latency-associated virus gene products inhibit expression of the pro-apoptotic Bcl-2-family member Bim and enhance cell survival. This involves the activities of the EBV nuclear proteins EBNA3A and EBNA3C and appears to be predominantly directed at regulating Bim mRNA synthesis, although post-transcriptional regulation of Bim has been reported. Here we show that protein and RNA stability make little or no contribution to the EBV-associated repression of Bim in latently infected B cells. However, treatment of cells with inhibitors of histone deacetylase (HDAC) and DNA methyltransferase (DNMT) enzymes indicated that epigenetic mechanisms are involved in the down-regulation of Bim. This was initially confirmed by chromatin immunoprecipitation analysis of histone acetylation levels on the Bim promoter. Consistent with this, methylation-specific PCR (MSP) and bisulphite sequencing of regions within the large CpG island located at the 5' end of Bim revealed significant methylation of CpG dinucleotides in all EBV-positive, but not EBV-negative B cells examined. Genomic DNA samples exhibiting methylation of the Bim promoter included extracts from a series of explanted EBV-positive Burkitt's lymphoma (BL) biopsies. Subsequent analyses of the histone modification H3K27-Me3 (trimethylation of histone H3 lysine 27) and CpG methylation at loci throughout the Bim promoter suggest that in EBV-positive B cells repression of Bim is initially associated with this repressive epigenetic histone mark gradually followed by DNA methylation at CpG dinucleotides. We conclude that latent EBV initiates a chain of events that leads to epigenetic repression of the tumour suppressor gene Bim in infected B cells and their progeny. This reprogramming of B cells could have important implications for our understanding of EBV persistence and the pathogenesis of EBV-associated disease, in particular BL.


Conflict of interest statement

The authors have declared that no competing interests exist.

Figures
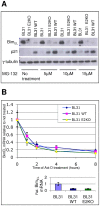
Figure 1
Figure 1. Down-regulation of Bim in EBV-positive cells is not due to proteosomal degradation or decreased mRNA stability.
A) Uninfected EBV-negative BL31 cells, or BL31 cells infected with a wild type (B95.8 strain) EBV-BAC (BL31 WT), or BL31 infected with an EBV-BAC carrying a deletion of the EBNA2 gene (BL31 E2KO) were treated with the proteasome inhibitor MG-132 for 8 hours at the concentrations indicated. Protein levels were assessed by western immunoblotting. p21WAF1 protein was used as a control and its accumulation after treatment in all cells indicates that proteasome-mediated degradation is inhibited. BimEL levels are unaffected and remain low in EBV infected cells. B) The same panel of cells was treated with the inhibitor of transcription actinomycin D (5 µg/ml) for 8 hours. BimEL mRNA levels were measured by quantitative RT-PCR, using constant amounts of total RNA for each time point, and are shown in the graph relative to the starting Bim mRNA levels. The amounts of BimEL mRNA at the beginning of the treatment, relative to the levels in uninfected cells, are shown on the column graph at the bottom. The rate of mRNA degradation is similar in all three cell-lines.
Figure 2
Figure 2. Schematic of the Bim promoter and CpG-island.
The Bim 5′ regulatory region has a very large CpG-island that could be subject to transcriptional control. The predicted CpG-island is 6718 bp long and contains 595 CpG dinucleotides. The regions amplified by PCR for chromatin immunoprecipitation analysis [ChIP, (A–F)] and methylation specific PCR [MSP, (I–V)] and the region sequenced after bisulphite conversion (bisulphite sequencing) are shown, with their positions relative to the transcription initiation site indicated. The locations of the predicted transcription initiation site and start codon are indicated .
Figure 3
Figure 3. Bim expression can be up-regulated in EBV infected cells after treatment with HDAC or DNMT inhibitors.
A) EBV-negative BL31, EBV-positive BL31 WT and LCL-CH were treated with TSA (500 nM), 5′ azacytidine (AZA; 4 mM) or sodium butyrate (Na But; 2.5 mM) for up to 48 hours. BimEL protein levels were assessed by western immunoblotting. B) After similar treatments BimEL mRNA levels were measured by quantitative RT-PCR. BimEL mRNA levels were all normalized with GAPDH mRNA levels. The values over the columns indicate their height, which represents abundance of Bim mRNA relative to the standards used, after normalization with GAPDH mRNA levels.
Figure 4
Figure 4. Latent EBV decreases occupancy of acetylated histone-H3 and histone-H4 on the Bim promoter.
ChIPs were performed on EBV-negative BLs (BL31 and BL41) and BLs infected with a wild type EBV-BAC (BL31 WT) or virus (BL41 B95.8), using antibodies against acetylated histone H3 (K9Ac, K14Ac) and acetylated histone H4 (K4Ac, K7Ac, K11Ac, K15Ac). Immunoprecipitated DNA, associated with acetylated histones, was assayed by quantitative PCR and expressed in the graphs as fold enrichment relative to input chromatin. Changes are specific to Bim, since occupancy of acetylated histones on the Bim promoter decreases significantly in EBV-infected cells (upper panels). Occupancy of β-Actin promoter does not change significantly whether or not the cells carry EBV (lower panels).
Figure 5
Figure 5. MSP analysis of the Bim promoter in EBV-negative and EBV-positive cells.
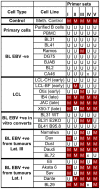
Five different sets of methylation specific primers were used for five different regions of the Bim promoter. In the matrix presented, the DNA methylation state assessed with the MSP primers is indicated for each primer set used. When an amplification product was apparent with the primers specific for unmethylated DNA, but not with the primers specific for methylated DNA of the same region, the cell line was scored as unmethylated (U in colourless boxes) at the regions the MSP primers anneal. When an amplification product was apparent with the primers specific for methylated DNA the cell line was scored as methylated (M in red boxes), for the relevant regions. X indicates that MSP was not performed with this primer set on this sample. DNA isolated from peripheral blood mononuclear cells (PBMC) and purified primary B cells was used as control for unmethylated DNA. In vitro methylated DNA from Jurkat cells was used as control for methylated DNA (Meth).
Figure 6
Figure 6. Bisulphite sequence analysis of the Bim promoter from cell lines.
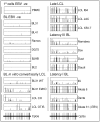
A region of 565 bp was sequenced and 36 CpGs were scored within this for their methylation state. An average of 12 clones for each cell line were analysed. The position of the bars on the X-axis within each box exactly corresponds to the position of the CpG in the sequenced region. The height of the bars reflects the percentage of sequenced clones found to have a methylated cytosine at that particular CpG dinucleotide. If the bar reaches the top of the box all clones were methylated at the particular CpG (100%). All EBV-positive cell lines appear to be significantly more methylated than all the EBV-negative cells. EBV-positive cell lines shown include in vitro converts, early and late passage LCLs and tumour-derived cell lines with either latency III or latency I patterns of EBV expression. In the bottom right panel results for Akata 31 are shown, a cell line that was derived from a culture of latency I Akata, but that has lost the EBV episome.
Figure 7
Figure 7. Bim promoter DNA is methylated in biopsies from EBV-positive BL.
MSP was performed for DNA isolated from biopsy material, in the same manner as with DNA from cell cultures (Figure 6 and Materials and Methods). In the matrix presented, the methylation state of the Bim promoter is shown for the regions assessed with each of the 5 MSP primer sets used. CpG methylation is indicated with “M” in red boxes. The unmethylated state is indicated with “U” in colourless boxes. The EBV status for each biopsy was determined by microscopy and EBER RISH and is indicated on the right panel (see also Figure 8 for representative examples). In vitro methylated DNA (Meth) and primary cells (PBMCs and B cells) were used as positive and negative controls respectively. Two EBV-negative, lymphoid infiltrates showed no evidence of DNA methylation by MSP at the Bim promoter.
Figure 8
Figure 8. DNA methylation analysis of the Bim promoter by MSP and bisulphite sequencing in two EBER-positive BL biopsies.
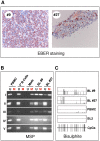
A) EBER RISH was performed to confirm the presence of EBV in tumour material. Cells staining brown-pink are positive for EBER RNA. B) MSP was performed for DNA isolated from the biopsies, in the same manner as with DNA from cell cultures (Figure 6 and Materials and Methods). Amplified DNA was visualized by agarose gel electrophoresis, for all primer sets (I–V), with primer sets specific for unmethylated state (U) or methylated state (M). C) Bisulphite sequencing was performed on DNA from these two EBV-positive biopsies to study DNA methylation at higher resolution. The results of sequencing DNA from PBMC and BL2 are shown in the bottom two panels for comparison.
Figure 9
Figure 9. Increased levels of H3K27-Me3 along the Bim promoter in EBV infected cells.
ChIPs were performed to study the occupancy of histone H3, trimethylated at K27, on the Bim promoter, relative to EBV status. The occupancy for BL31 and BL41 cells, infected with EBV or left uninfected are shown. Six primer pairs (A–F) were used corresponding to sites across the promoter/CpG-island region (see Figure 2 for locations). For each primer pair immunoprecipitated DNA associated with H3K27-Me3 was assessed by quantitative PCR and is expressed in the graph as fold enrichment relative to input chromatin. Trimethylated histone H3 at K27 is more abundant on the Bim promoter of EBV infected cells.
Figure 10
Figure 10. H3K27-Me3 and DNA methylation profiles along the Bim promoter.
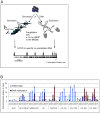
A) Schematic showing the analysis strategy. Chromatin and isolated DNA were sonicated and used for precipitation of either DNA associated with H3K27-Me3 or methylated DNA. The same 6 pairs of primers specific for loci spanning the Bim promoter (A–F, see Figures 2 and 9) were used to assess both H3K27-Me3 and DNA methylation in different cell lines. The correlation between these two epigenetic marks could thus be followed across the promoter region as indicated. B) BL41, infected with EBV or uninfected, latency III Namalwa, latency I Eli and Akata 6, early LCLs CH and Otis, and late LCLs IB4 and X50-7 were studied. The bars represent fold enrichment for co-precipitated DNA relative to input chromatin/DNA into each precipitation, as determined by quantitative PCR. The height of the bars is representative of the abundance of each epigenetic mark at the locus assessed by each primer set. The absolute abundance cannot be compared between the different epigenetic marks, because different precipitation methods were used (see Materials and Methods section). However, the trends for each mark across the promoter and between cell lines could be assessed.

Similar articles

Cited by

References

    1. Crawford DH. Biology and disease associations of Epstein-Barr virus. Philos Trans R Soc Lond B Biol Sci. 2001;356:461–473. - PMC - PubMed
    1. Bornkamm GW, Hammerschmidt W. Molecular virology of Epstein-Barr virus. Philos Trans R Soc Lond B Biol Sci. 2001;356:437–459. - PMC - PubMed
    1. Thorley-Lawson DA, Gross A. Persistence of the Epstein-Barr virus and the origins of associated lymphomas. N Engl J Med. 2004;350:1328–1337. - PubMed
    1. Anderton E, Yee J, Smith P, Crook T, White RE, et al. Two Epstein-Barr virus (EBV) oncoproteins cooperate to repress expression of the proapoptotic tumour-suppressor Bim: clues to the pathogenesis of Burkitt's lymphoma. Oncogene. 2007;27:421–433. - PubMed
    1. Strasser A. The role of BH3-only proteins in the immune system. Nat Rev Immunol. 2005;5:189–200. - PubMed

Publication types

MeSH terms