

Structure and biochemical characterization of protein acetyltransferase from Sulfolobus solfataricus
- PMID: 19473964
- PMCID: PMC2740566
- DOI: 10.1074/jbc.M109.014951
Structure and biochemical characterization of protein acetyltransferase from Sulfolobus solfataricus
Abstract
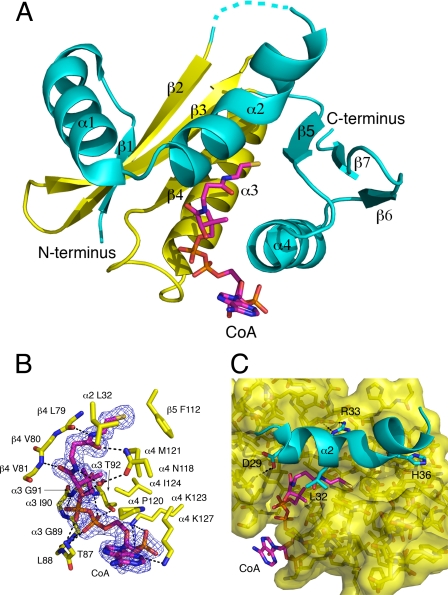
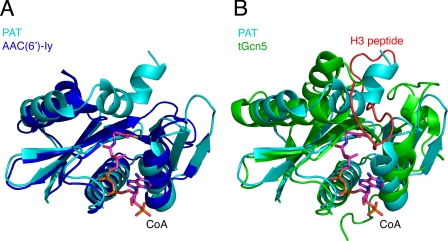
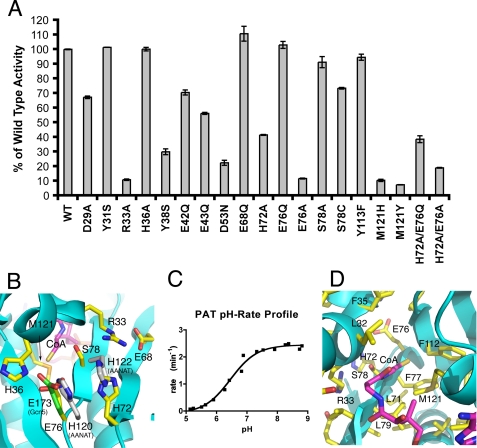
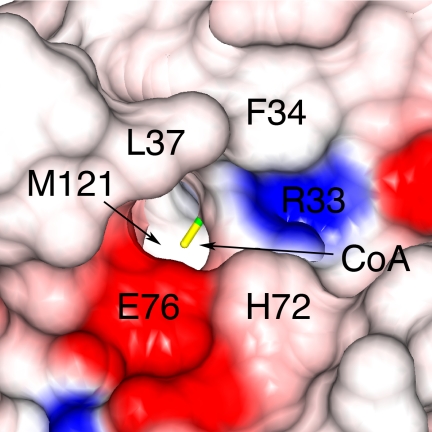
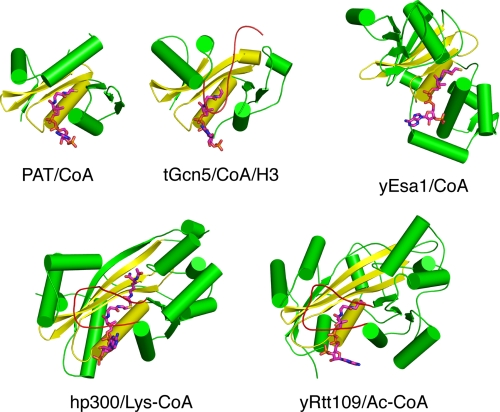
The Sulfolobus solfataricus protein acetyltransferase (PAT) acetylates ALBA, an abundant nonspecific DNA-binding protein, on Lys(16) to reduce its DNA affinity, and the Sir2 deacetylase reverses the modification to cause transcriptional repression. This represents a "primitive" model for chromatin regulation analogous to histone modification in eukaryotes. We report the 1.84-A crystal structure of PAT in complex with coenzyme A. The structure reveals homology to both prokaryotic GNAT acetyltransferases and eukaryotic histone acetyltransferases (HATs), with an additional "bent helix" proximal to the substrate binding site that might play an autoregulatory function. Investigation of active site mutants suggests that PAT does not use a single general base or acid residue for substrate deprotonation and product reprotonation, respectively, and that a diffusional step, such as substrate binding, may be rate-limiting. The catalytic efficiency of PAT toward ALBA is low relative to other acetyltransferases, suggesting that there may be better, unidentified substrates for PAT. The structural similarity of PAT to eukaryotic HATs combined with its conserved role in chromatin regulation suggests that PAT is evolutionarily related to the eukaryotic HATs.
Figures
Similar articles
-
Crystallization and preliminary X-ray diffraction analysis of PAT, an acetyltransferase from Sulfolobus solfataricus.Acta Crystallogr Sect F Struct Biol Cryst Commun. 2008 Nov 1;64(Pt 11):1049-51. doi: 10.1107/S1744309108031965. Epub 2008 Oct 31. Acta Crystallogr Sect F Struct Biol Cryst Commun. 2008. PMID: 18997339 Free PMC article.
-
Sir2 and the acetyltransferase, Pat, regulate the archaeal chromatin protein, Alba.J Biol Chem. 2005 Jun 3;280(22):21122-8. doi: 10.1074/jbc.M501280200. Epub 2005 Apr 11. J Biol Chem. 2005. PMID: 15824122
-
Implications for the evolution of eukaryotic amino-terminal acetyltransferase (NAT) enzymes from the structure of an archaeal ortholog.Proc Natl Acad Sci U S A. 2013 Sep 3;110(36):14652-7. doi: 10.1073/pnas.1310365110. Epub 2013 Aug 19. Proc Natl Acad Sci U S A. 2013. PMID: 23959863 Free PMC article.
-
Structure and mechanism of non-histone protein acetyltransferase enzymes.FEBS J. 2013 Nov;280(22):5570-81. doi: 10.1111/febs.12373. Epub 2013 Jun 28. FEBS J. 2013. PMID: 23742047 Free PMC article. Review.
-
Biochemical and structural characterization of recombinant histone acetyltransferase proteins.Methods Enzymol. 2004;376:106-19. doi: 10.1016/S0076-6879(03)76007-8. Methods Enzymol. 2004. PMID: 14975301 Review. No abstract available.
Cited by
-
cAMP-regulated protein lysine acetylases in mycobacteria.J Biol Chem. 2010 Aug 6;285(32):24313-23. doi: 10.1074/jbc.M110.118398. Epub 2010 May 27. J Biol Chem. 2010. PMID: 20507997 Free PMC article.
-
Acylation - A New Means to Control Traffic Through the Golgi.Front Cell Dev Biol. 2019 Jun 12;7:109. doi: 10.3389/fcell.2019.00109. eCollection 2019. Front Cell Dev Biol. 2019. PMID: 31245373 Free PMC article. Review.
-
Functional Insights Into Protein Acetylation in the Hyperthermophilic Archaeon Sulfolobus islandicus.Mol Cell Proteomics. 2019 Aug;18(8):1572-1587. doi: 10.1074/mcp.RA119.001312. Epub 2019 Jun 9. Mol Cell Proteomics. 2019. PMID: 31182439 Free PMC article.
-
Structural insights into the substrate specificity of the Rhodopseudomonas palustris protein acetyltransferase RpPat: identification of a loop critical for recognition by RpPat.J Biol Chem. 2012 Nov 30;287(49):41392-404. doi: 10.1074/jbc.M112.417360. Epub 2012 Oct 17. J Biol Chem. 2012. PMID: 23076154 Free PMC article.
-
Biochemical and thermodynamic analyses of Salmonella enterica Pat, a multidomain, multimeric N(ε)-lysine acetyltransferase involved in carbon and energy metabolism.mBio. 2011 Oct 18;2(5):e00216-11. doi: 10.1128/mBio.00216-11. Print 2011. mBio. 2011. PMID: 22010215 Free PMC article.
References
-
- Sandman K., Reeve J. N. (2005) Curr. Opin. Microbiol. 8, 656–661 - PubMed
-
- Edmondson S. P., Shriver J. W. (2001) Methods Enzymol. 334, 129–145 - PubMed
-
- Bell S. D., Botting C. H., Wardleworth B. N., Jackson S. P., White M. F. (2002) Science 296, 148–151 - PubMed
-
- Marsh V. L., Peak-Chew S. Y., Bell S. D. (2005) J. Biol. Chem. 280, 21122–21128 - PubMed
Publication types
MeSH terms
Substances
Grants and funding
LinkOut - more resources
Full Text Sources
Miscellaneous
