. 2009 Jul;83(14):7305-21.
doi: 10.1128/JVI.02207-08. Epub 2009 May 6.

Induction of robust cellular and humoral virus-specific adaptive immune responses in human immunodeficiency virus-infected humanized BLT mice

Affiliations

Induction of robust cellular and humoral virus-specific adaptive immune responses in human immunodeficiency virus-infected humanized BLT mice

Diana M Brainard et al. J Virol. 2009 Jul.

Abstract

The generation of humanized BLT mice by the cotransplantation of human fetal thymus and liver tissues and CD34(+) fetal liver cells into nonobese diabetic/severe combined immunodeficiency mice allows for the long-term reconstitution of a functional human immune system, with human T cells, B cells, dendritic cells, and monocytes/macrophages repopulating mouse tissues. Here, we show that humanized BLT mice sustained high-level disseminated human immunodeficiency virus (HIV) infection, resulting in CD4(+) T-cell depletion and generalized immune activation. Following infection, HIV-specific humoral responses were present in all mice by 3 months, and HIV-specific CD4(+) and CD8(+) T-cell responses were detected in the majority of mice tested after 9 weeks of infection. Despite robust HIV-specific responses, however, viral loads remained elevated in infected BLT mice, raising the possibility that these responses are dysfunctional. The increased T-cell expression of the negative costimulator PD-1 recently has been postulated to contribute to T-cell dysfunction in chronic HIV infection. As seen in human infection, both CD4(+) and CD8(+) T cells demonstrated increased PD-1 expression in HIV-infected BLT mice, and PD-1 levels in these cells correlated positively with viral load and inversely with CD4(+) cell levels. The ability of humanized BLT mice to generate both cellular and humoral immune responses to HIV will allow the further investigation of human HIV-specific immune responses in vivo and suggests that these mice are able to provide a platform to assess candidate HIV vaccines and other immunotherapeutic strategies.


Figures

FIG. 1.
FIG. 1.
Human progenitor cell reconstitution of BLT mice. (A) HSC engraftment 22 weeks posttransplantation in the bone marrow of BLT mice. HSC are identified in image i as CD45dim, CD34+ cells among lymphoid-gated cells and in image ii as CD45dim, low-side-scatter, CD34+ cells. Numbers in the panels represent percentages of cells contained in the indicated gates. Data presented are representative of n = 3 mice. (B) HSC engraftment 22 weeks posttransplantation in the spleens of BLT mice. HSC are identified in images i and ii as described for panel A. Data presented are representative of n = 3 mice. (C) Gross appearance of bilateral thymic grafts in a representative BLT mouse following reconstitution with human immune cells, demonstrating substantial growth in size from the ∼1-mm3 fragments of human fetal tissues transplanted. (D) CD4 and CD8 expression of human thymocytes in the thymic graft of a representative BLT mouse 14 weeks after transplantation.
FIG. 2.
FIG. 2.
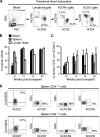
Human T-cell reconstitution of BLT mice. (A) The multiparameter flow cytometry gating scheme for the identification of human lymphocyte populations in BLT mice is shown for a representative sample of peripheral blood from a mouse 22 weeks posttransplantation. Numbers in the panels represent percentages of cells contained in the indicated gates. SSC, side scatter; FSC, forward scatter. (B, C) BLT mice were sacrificed at the indicated times posttransplantation, and human cells were identified in blood, spleen, and LN by flow cytometry following staining with human CD45+ antibody. Data in panel B are presented as the percentages of human CD45+ cells among blood, spleen, and LN lymphocyte populations; data in panel C are presented as the percentages of human CD3+ T cells among human CD45+ leukocytes. Data represent mean values ± standard errors for n = 5 to 12 mice per group. (D) Analyses of naïve versus memory phenotypes and chemokine receptor expression of CD4+ and CD8+ T cells from the spleen of a representative humanized BLT mouse 18 weeks after transplantation.
FIG. 3.
FIG. 3.
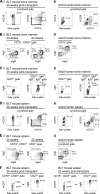
Human B-cell reconstitution of BLT mice bone marrow and spleen. Bone marrow cells in panels A, B, and C and splenocytes in panels D, E, and F were analyzed by flow cytometry. Results for BLT mice are presented in image i and are compared to results for cells from adult human tissues in image ii. BLT mouse and adult human tissues were analyzed in independent experiments; all antibodies used were anti-human. Numbers in the panels are the percentages of cells in the indicated gates. Data presented are representative of n = 3 BLT mice at each time point (20 and 22 weeks posttransplantation) and n = 3 humans. All BLT mouse panels for a give time point represent data from the same mouse. CD19+ and CD19+, CD20+ B cells were identified in panels A and D, follicular-zone B cells were identified in panels B and E, marginal-zone B cells were identified in panels C and F, and plasmablasts were identified in panel C. In image i of panel C, the percentage of marginal-zone B cells demonstrated in the left flow plot (3.7%) corresponds to 63 out of 1,707 total events shown, and the percentage of plasmablasts demonstrated in the right flow plot (1.9%) corresponds to 1 out of 54 total events shown. Gates were drawn as previously published (8-10).
FIG. 4.
FIG. 4.
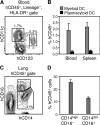
DC and monocyte/macrophage reconstitution of BLT mice. (A) Identification of human mDCs and pDCs in the peripheral blood of a BLT mouse 20 weeks posttransplantation. mDCs are identified as CD11c+ cells, and pDCs are identified as CD123+ cells among human CD45+, lineage-negative (CD16, CD3, CD19), HLA-DR+ cells. Numbers in the panel represent the percentages of cells contained in the indicated gates. (B) mDC and pDC engraftment in the blood and spleens of BLT mice 20 weeks posttransplantation. Data represent means ± standard errors for n = 3 mice. (C) Identification of human monocytes/macrophages in the lungs of a BLT mouse 20 weeks posttransplantation. Numbers in the panel represent the percentages of cells contained in the indicated gates. (D) Engraftment of CD14high, CD16 classical monocytes and mature macrophage-like CD14dim, CD16+ monocytes in the lungs of BLT mice 20 weeks posttransplantation. Data represent means ± standard errors for n = 3 mice.
FIG. 5.
FIG. 5.
Histology of human immune cell reconstitution in the LN, spleen, and gastrointestinal tract of BLT mice. Immunohistochemical staining of LN, spleens (SPL), and small intestine (SI) of BLT mice 20 to 22 weeks posttransplantation for the indicated human antigens demonstrated the robust reconstitution of CD3+ T cells, CD4+ T cells, CD8+ T cells, CD20+ B cells, and CD68+ macrophages (all bars = 200 μm; the magnification is the same for each panel from a given tissue).
FIG. 6.
FIG. 6.
Sustained, high-level, disseminated HIV infection of BLT mice. (A) Humanized BLT mice were injected intraperitoneally with HIVJRCSF (2000 and 10,000 TCID50) or HIVADA (50,000 and 75,000 TCID50) and bled weekly for the following 8 weeks to assess detectable plasma viremia. Data are presented as the percentages of mice inoculated with each infecting dose that developed detectable viral loads (VL). (B) Plasma viral loads were measured every 1 to 2 weeks following inoculation of BLT mice with the indicated HIV isolate and infecting dose. The dotted line indicates the lower limit of detection for the RT-PCR assay (400 copies/ml). Data represent mean values ± standard errors for three to seven mice analyzed at each time point. (C to F) Identification of HIV-infected cells by in situ hybridization for HIV RNA, and the concurrent identification of human T cells by immunohistochemical staining for human CD3, demonstrated HIV-infected human T cells in the periarteriolar lymphoid sheath of the spleen and diffusely distributed in the LN of a representative HIV-infected BLT mouse. Bars: panel C, 100 μm; panel D, 10 μm; panel E, 200 μm; panel F, 20 μm.
FIG. 7.
FIG. 7.
CD4+ T-cell depletion and immune activation in HIV-infected BLT mice. (A) Percentages of CD3+ T cells in the blood of BLT mice that were CD4+ T cells following infection with 75,000 TCID50 of HIVADA. Each circle represents one mouse; means are shown as solid lines. (B) Percentages of CD4+ and CD8+ T cells in the blood of humanized BLT mice that were CCR5+ following infection with 75,000 TCID50 of HIVADA. Representative flow cytometry plots demonstrate the CCR5 expression of CD4+ and CD8+ T cells at 3 and 16 weeks (wks) p.i. Numbers in the plots represent the percentages of cells contained in the indicated gates. Data presented in the accompanying bar graph represent mean values ± standard errors for three to six mice at each time point. SSC, side scatter. (C to G) The expression levels of multiple activation markers by CD8+ (closed circles) and CD4+ T cells (open circles) were assessed by flow cytometry in two matched blood samples obtained from the same BLT mice, the first obtained pre-HIV infection (pre) and the second 12 weeks p.i. with 75,000 TCID50 HIVADA (post). Each circle represents one mouse; means are shown as solid lines. P values, as determined by paired Student's t tests, are shown for statistically significant comparisons and those comparisons approaching statistical significance.
FIG. 8.
FIG. 8.
HIV-specific humoral immune responses in HIV-infected BLT mice. (A) Western blot analyses are shown for representative HIV-infected BLT mice with negative (n = 2), equivocal (n = 3), and positive (n = 4) HIV-specific antibody responses in plasma. Positive and negative human controls are shown for comparison. (B) Time course of the development of HIV-specific antibodies in BLT mice following infection. The total number of mice tested at each time point is indicated.
FIG. 9.
FIG. 9.
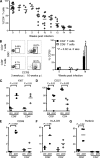
HIV-specific cellular immune responses in HIV-infected BLT mice. (A) Representative ELISPOT data demonstrating HIV peptide-induced IFN-γ secretion by BLT mouse mononuclear cells pooled from the blood, spleen, and LN. The top panels show data using cells from an HIV-infected BLT mouse 10 weeks following infection; the bottom panels show data using cells from an uninfected BLT mouse. Cells were stimulated with overlapping 18-mer peptide pools spanning the HIV proteome, and positive responses to the indicated HIV proteins are shown, in addition to the no-peptide negative control and the phytohemagglutinin-positive control. (B) Analysis of ELISPOT data showing the magnitude and breadth of anti-HIV T-cell responses in four HIV-infected BLT mice (designated mouse 1 [m1], m2, m3, and m4). (C) Confirmation of positive ELISPOT responses by ICS of BLT mouse mononuclear cells for IFN-γ production following autologous peptide pool stimulation. Representative contour plots show both CD4+ and CD8+ T-cell HIV-specific responses. Numbers in the panels represent percentages of cells contained in the indicated gates. A mouse reconstituted with HLA-A2-expressing human tissue (m3) was found to generate a robust T-cell response directed against the A2-restricted Gag epitope SLYNTVATL (right panels). (D) Uninfected BLT mice did not demonstrate any T-cell responses to HIV peptides.
FIG. 10.
FIG. 10.
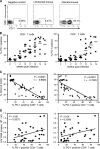
T-cell PD-1 upregulation in HIV-infected BLT mice. (A) PD-1 expression by CD8+ T cells from representative uninfected and infected BLT mice (12 weeks p.i.). SSC, side scatter. (B) Percentages of CD8+ and CD4+ T cells in BLT mice expressing PD-1 at the indicated time points following infection with 75,000 TCID50 HIVADA. Each circle represents an individual mouse; means are shown as solid lines. (C) Correlations between the percentages of CD8+ and CD4+ T cells expressing PD-1, and the percentages of peripheral blood T cells that were CD4+ T cells, in BLT mice following infection with 75,000 TCID50 HIVADA. (D) Correlations between the percentages of CD8+ and CD4+ T cells expressing PD-1, and plasma viral loads, in BLT mice following infection with 75,000 TCID50 HIVADA.

Similar articles

Cited by

References

    1. Altfeld, M., E. S. Rosenberg, R. Shankarappa, J. S. Mukherjee, F. M. Hecht, R. L. Eldridge, M. M. Addo, S. H. Poon, M. N. Phillips, G. K. Robbins, P. E. Sax, S. Boswell, J. O. Kahn, C. Brander, P. J. Goulder, J. A. Levy, J. I. Mullins, and B. D. Walker. 2001. Cellular immune responses and viral diversity in individuals treated during acute and early HIV-1 infection. J. Exp. Med. 193169-180. - PMC - PubMed
    1. Baenziger, S., R. Tussiwand, E. Schlaepfer, L. Mazzucchelli, M. Heikenwalder, M. O. Kurrer, S. Behnke, J. Frey, A. Oxenius, H. Joller, A. Aguzzi, M. G. Manz, and R. F. Speck. 2006. Disseminated and sustained HIV infection in CD34+ cord blood cell-transplanted Rag2−/− γc−/− mice. Proc. Natl. Acad. Sci. USA 10315951-15956. - PMC - PubMed
    1. Berges, B. K., S. R. Akkina, J. M. Folkvord, E. Connick, and R. Akkina. 2008. Mucosal transmission of R5 and X4 tropic HIV-1 via vaginal and rectal routes in humanized Rag2−/− γc−/− (RAG-hu) mice. Virology 373342-351. - PMC - PubMed
    1. Berges, B. K., W. H. Wheat, B. E. Palmer, E. Connick, and R. Akkina. 2006. HIV-1 infection and CD4 T-cell depletion in the humanized Rag2−/− γc−/− (RAG-hu) mouse model. Retrovirology 376. - PMC - PubMed
    1. Bird, P., J. E. Calvert, and P. L. Amlot. 1990. Distinctive development of IgG4 subclass antibodies in the primary and secondary responses to keyhole limpet haemocyanin in man. Immunology 69355-360. - PMC - PubMed

Publication types

MeSH terms