

Glioma-derived mutations in IDH1 dominantly inhibit IDH1 catalytic activity and induce HIF-1alpha
- PMID: 19359588
- PMCID: PMC3251015
- DOI: 10.1126/science.1170944
Glioma-derived mutations in IDH1 dominantly inhibit IDH1 catalytic activity and induce HIF-1alpha
Abstract
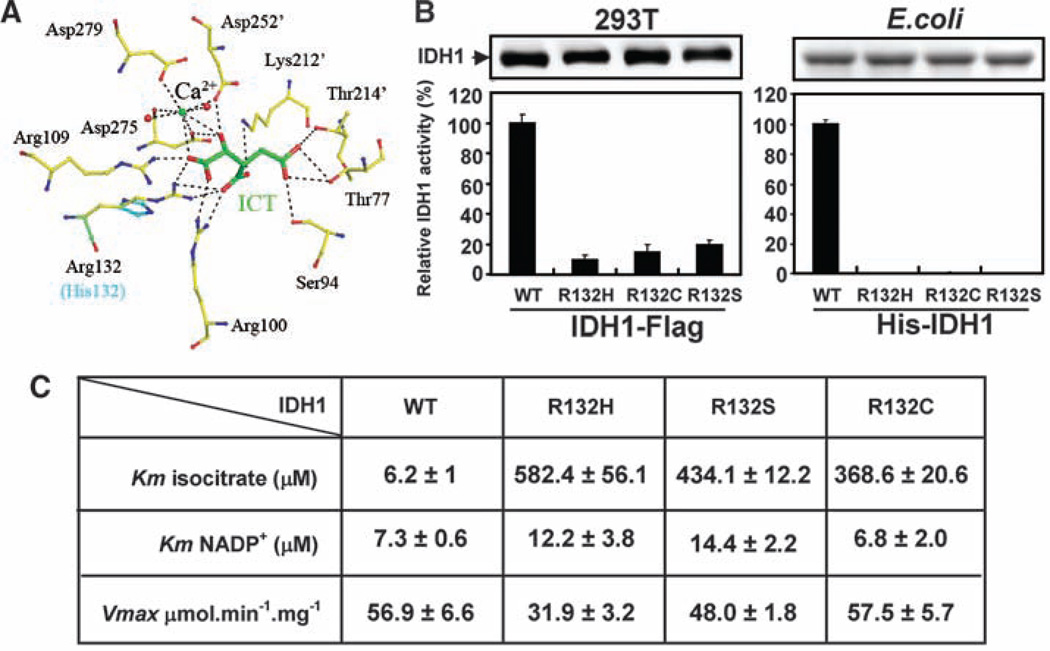
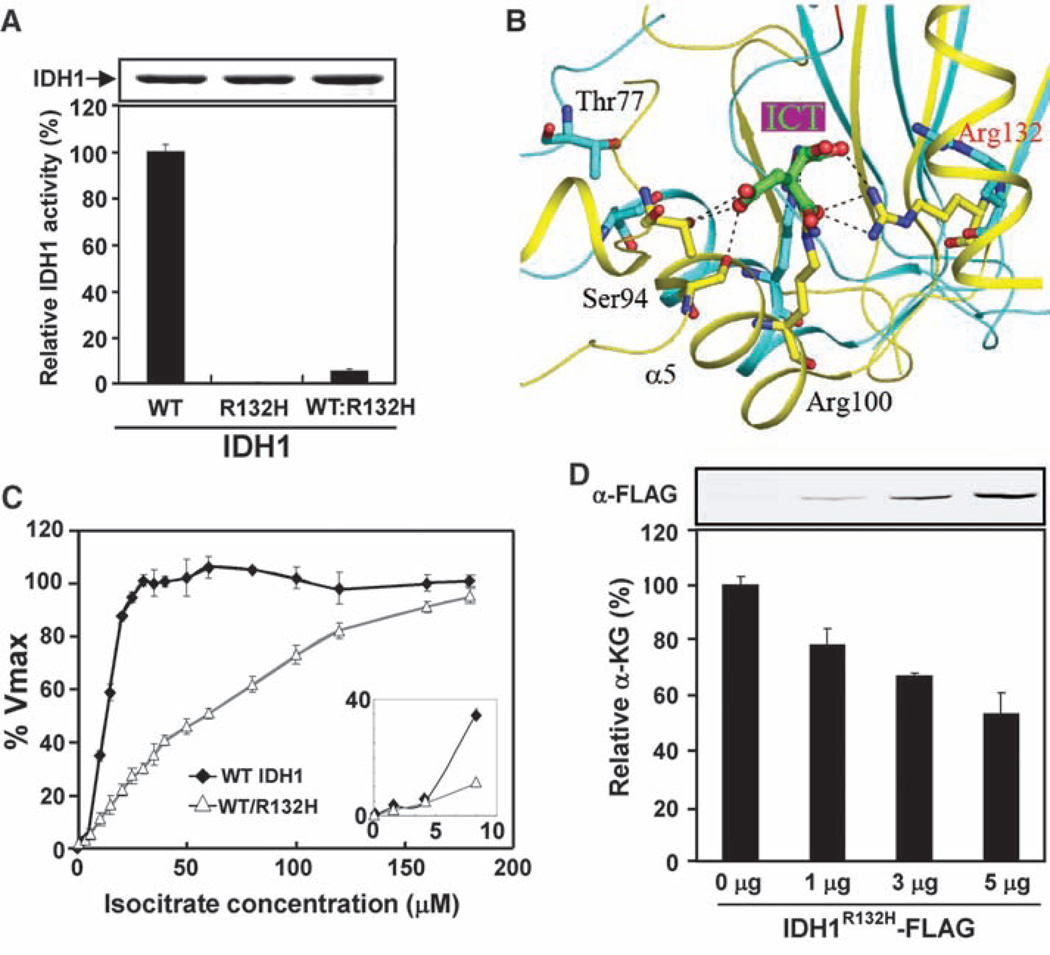
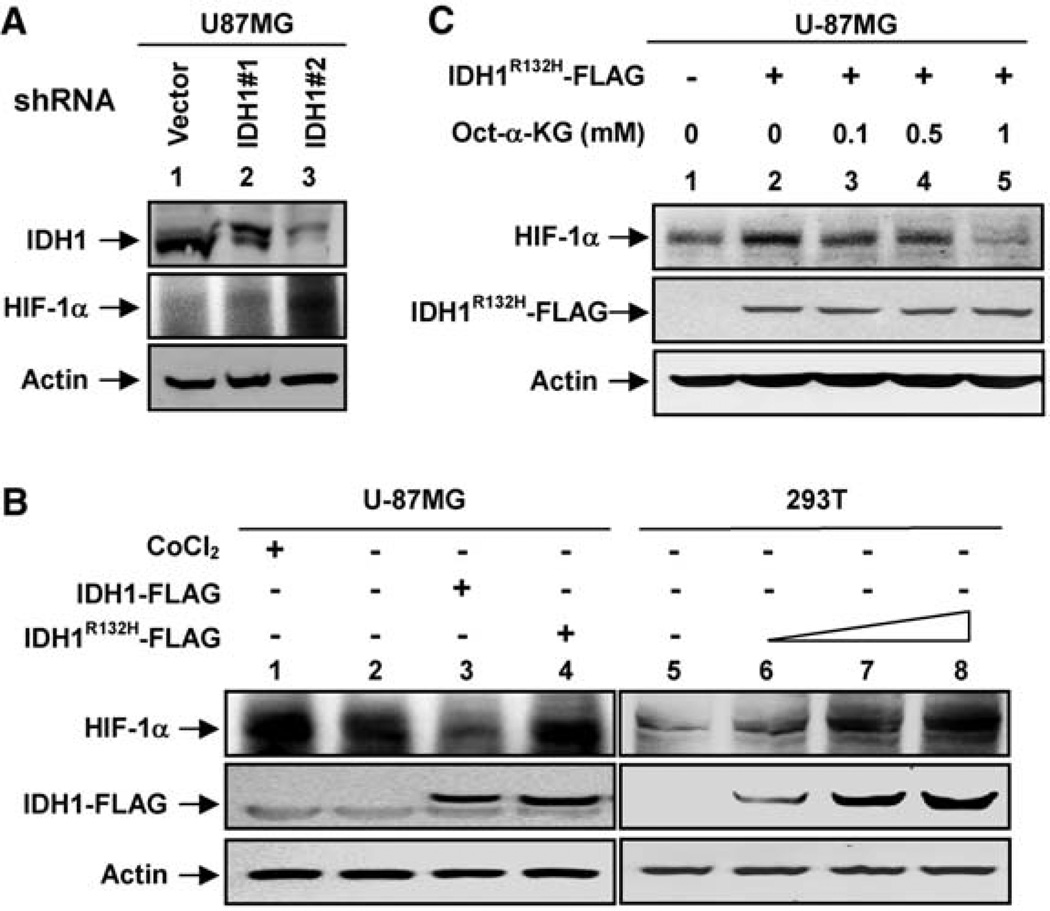
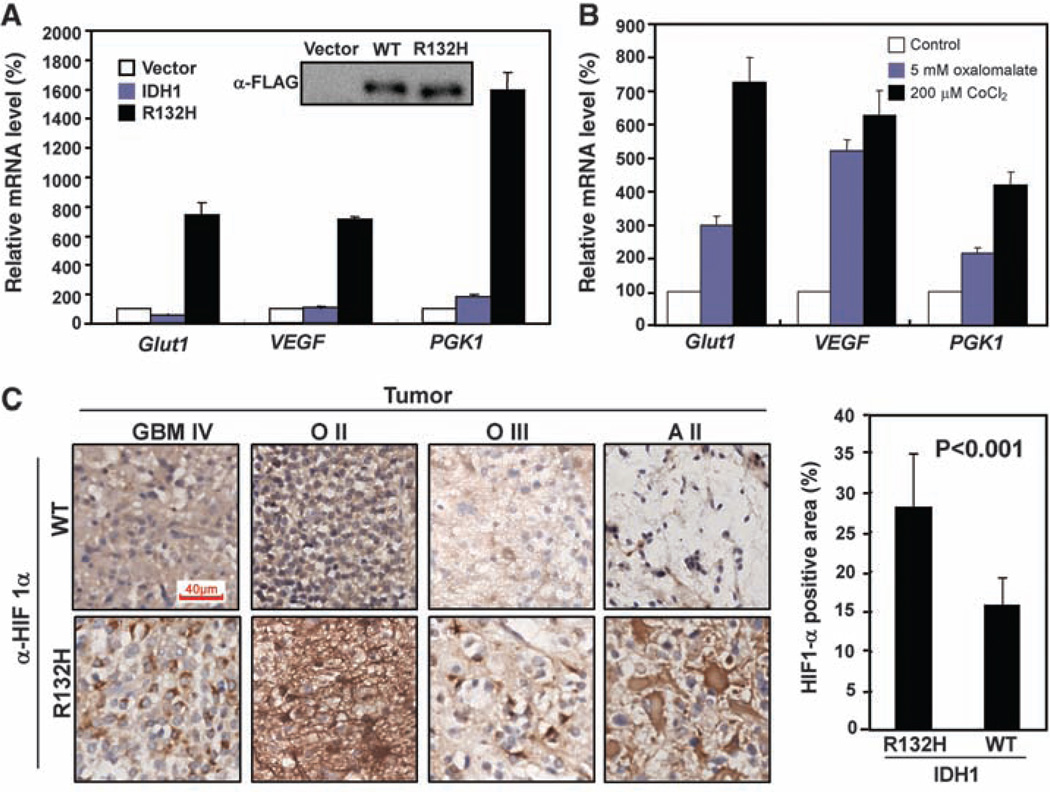
Heterozygous mutations in the gene encoding isocitrate dehydrogenase-1 (IDH1) occur in certain human brain tumors, but their mechanistic role in tumor development is unknown. We have shown that tumor-derived IDH1 mutations impair the enzyme's affinity for its substrate and dominantly inhibit wild-type IDH1 activity through the formation of catalytically inactive heterodimers. Forced expression of mutant IDH1 in cultured cells reduces formation of the enzyme product, alpha-ketoglutarate (alpha-KG), and increases the levels of hypoxia-inducible factor subunit HIF-1alpha, a transcription factor that facilitates tumor growth when oxygen is low and whose stability is regulated by alpha-KG. The rise in HIF-1alpha levels was reversible by an alpha-KG derivative. HIF-1alpha levels were higher in human gliomas harboring an IDH1 mutation than in tumors without a mutation. Thus, IDH1 appears to function as a tumor suppressor that, when mutationally inactivated, contributes to tumorigenesis in part through induction of the HIF-1 pathway.
Figures
Comment in
-
Cancer. Puzzling patterns of predisposition.Science. 2009 Apr 10;324(5924):192-4. doi: 10.1126/science.1173362. Science. 2009. PMID: 19359573 No abstract available.
Similar articles
-
Analysis of isocitrate dehydrogenase 1 mutation in 97 patients with glioma.J Mol Neurosci. 2012 Jul;47(3):442-7. doi: 10.1007/s12031-011-9681-5. Epub 2011 Nov 24. J Mol Neurosci. 2012. PMID: 22113362
-
Enrichment of branched chain amino acid transaminase 1 correlates with multiple biological processes and contributes to poor survival of IDH1 wild-type gliomas.Aging (Albany NY). 2021 Jan 20;13(3):3645-3660. doi: 10.18632/aging.202328. Epub 2021 Jan 20. Aging (Albany NY). 2021. PMID: 33493139 Free PMC article.
-
[Mutation of isocitrate dehydrogenase gene in Chinese patients with glioma].Zhonghua Bing Li Xue Za Zhi. 2013 May;42(5):292-8. doi: 10.3760/cma.j.issn.0529-5807.2013.05.002. Zhonghua Bing Li Xue Za Zhi. 2013. PMID: 24004584 Chinese.
-
Glioma-derived mutations in IDH: from mechanism to potential therapy.Biochem Biophys Res Commun. 2010 Jun 25;397(2):127-30. doi: 10.1016/j.bbrc.2010.05.115. Epub 2010 May 27. Biochem Biophys Res Commun. 2010. PMID: 20510884 Review.
-
Isocitrate dehydrogenase mutations in gliomas.Neuro Oncol. 2016 Jan;18(1):16-26. doi: 10.1093/neuonc/nov136. Epub 2015 Jul 16. Neuro Oncol. 2016. PMID: 26188014 Free PMC article. Review.
Cited by
-
Nutrient sensing, metabolism, and cell growth control.Mol Cell. 2013 Feb 7;49(3):379-87. doi: 10.1016/j.molcel.2013.01.019. Mol Cell. 2013. PMID: 23395268 Free PMC article. Review.
-
Translational Research Platform for Malignant Central Nervous System Tumors.Neurol Med Chir (Tokyo). 2024 Sep 15;64(9):323-329. doi: 10.2176/jns-nmc.2024-0078. Epub 2024 Aug 6. Neurol Med Chir (Tokyo). 2024. PMID: 39111869 Free PMC article.
-
Serum 2-hydroxyglutarate levels predict isocitrate dehydrogenase mutations and clinical outcome in acute myeloid leukemia.Blood. 2013 Jun 13;121(24):4917-24. doi: 10.1182/blood-2013-03-493197. Epub 2013 May 2. Blood. 2013. PMID: 23641016 Free PMC article. Clinical Trial.
-
Specific patterns of H3K79 methylation influence genetic interaction of oncogenes in AML.Blood Adv. 2020 Jul 14;4(13):3109-3122. doi: 10.1182/bloodadvances.2020001922. Blood Adv. 2020. PMID: 32634241 Free PMC article.
-
Genetics and immunotherapy: using the genetic landscape of gliomas to inform management strategies.J Neurooncol. 2015 Jul;123(3):373-83. doi: 10.1007/s11060-015-1730-4. Epub 2015 Feb 21. J Neurooncol. 2015. PMID: 25697584 Review.
References
Publication types
MeSH terms
Substances
Grants and funding
LinkOut - more resources
Full Text Sources
Other Literature Sources
Medical
Molecular Biology Databases
Research Materials
Miscellaneous
