Critical loss of the balance between Th17 and T regulatory cell populations in pathogenic SIV infection
- PMID: 19214220
- PMCID: PMC2635016
- DOI: 10.1371/journal.ppat.1000295
Critical loss of the balance between Th17 and T regulatory cell populations in pathogenic SIV infection
Abstract
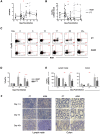
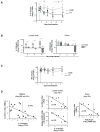
Chronic immune activation and progression to AIDS are observed after SIV infection in macaques but not in natural host primate species. To better understand this dichotomy, we compared acute pathogenic SIV infection in pigtailed macaques (PTs) to non-pathogenic infection in African green monkeys (AGMs). SIVagm-infected PTs, but not SIVagm-infected AGMs, rapidly developed systemic immune activation, marked and selective depletion of IL-17-secreting (Th17) cells, and loss of the balance between Th17 and T regulatory (Treg) cells in blood, lymphoid organs, and mucosal tissue. The loss of Th17 cells was found to be predictive of systemic and sustained T cell activation. Collectively, these data indicate that loss of the Th17 to Treg balance is related to SIV disease progression.
Conflict of interest statement
The authors have declared that no competing interests exist.
Figures
Similar articles
-
Immunological changes in simian immunodeficiency virus (SIV(agm))-infected African green monkeys (AGM): expanded cytotoxic T lymphocyte, natural killer and B cell subsets in the natural host of SIV(agm).J Gen Virol. 2002 Mar;83(Pt 3):631-640. doi: 10.1099/0022-1317-83-3-631. J Gen Virol. 2002. PMID: 11842258
-
Pathogenic Correlates of Simian Immunodeficiency Virus-Associated B Cell Dysfunction.J Virol. 2017 Nov 14;91(23):e01051-17. doi: 10.1128/JVI.01051-17. Print 2017 Dec 1. J Virol. 2017. PMID: 28931679 Free PMC article.
-
Severe depletion of CD4+ CD25+ regulatory T cells from the intestinal lamina propria but not peripheral blood or lymph nodes during acute simian immunodeficiency virus infection.J Virol. 2007 Dec;81(23):12748-57. doi: 10.1128/JVI.00841-07. Epub 2007 Sep 12. J Virol. 2007. PMID: 17855517 Free PMC article.
-
What can natural infection of African monkeys with simian immunodeficiency virus tell us about the pathogenesis of AIDS?AIDS Rev. 2004 Jan-Mar;6(1):40-53. AIDS Rev. 2004. PMID: 15168740 Review.
-
Th17 cells in natural SIV hosts.Curr Opin HIV AIDS. 2010 Mar;5(2):166-72. doi: 10.1097/COH.0b013e328335c161. Curr Opin HIV AIDS. 2010. PMID: 20543595 Review.
Cited by
-
Invariant NKT cells: regulation and function during viral infection.PLoS Pathog. 2012;8(8):e1002838. doi: 10.1371/journal.ppat.1002838. Epub 2012 Aug 16. PLoS Pathog. 2012. PMID: 22916008 Free PMC article. Review.
-
A dendrite in every pie: myeloid dendritic cells in HIV and SIV infection.Virulence. 2012 Nov 15;3(7):647-53. doi: 10.4161/viru.22491. Epub 2012 Nov 15. Virulence. 2012. PMID: 23154284 Free PMC article. Review.
-
Preferential loss of gut-homing α4β7 CD4+ T cells and their circulating functional subsets in acute HIV-1 infection.Cell Mol Immunol. 2016 Nov;13(6):776-784. doi: 10.1038/cmi.2015.60. Epub 2015 Aug 17. Cell Mol Immunol. 2016. PMID: 26277899 Free PMC article.
-
IFN-α blockade during ART-treated SIV infection lowers tissue vDNA, rescues immune function, and improves overall health.JCI Insight. 2022 Mar 8;7(5):e153046. doi: 10.1172/jci.insight.153046. JCI Insight. 2022. PMID: 35104248 Free PMC article.
-
Human Immunodeficiency Virus (HIV)-Infected CCR6+ Rectal CD4+ T Cells and HIV Persistence On Antiretroviral Therapy.J Infect Dis. 2020 Feb 18;221(5):744-755. doi: 10.1093/infdis/jiz509. J Infect Dis. 2020. PMID: 31796951 Free PMC article.
References
-
- Hazenberg MD, Hamann D, Schuitemaker H, Miedema F. T cell depletion in HIV-1 infection: how CD4+ T cells go out of stock. Nat Immunol. 2000;1:285–289. - PubMed
-
- McCune JM. The dynamics of CD4+ T-cell depletion in HIV disease. Nature. 2001;410:974–979. - PubMed
-
- Grossman Z, Meier-Schellersheim M, Sousa AE, Victorino RM, Paul WE. CD4+ T-cell depletion in HIV infection: are we closer to understanding the cause? Nat Med. 2002;8:319–323. - PubMed
-
- Douek DC, Picker LJ, Koup RA. T cell dynamics in HIV-1 infection. Annu Rev Immunol. 2003;21:265–304. - PubMed
-
- Heeney JL, Dalgleish AG, Weiss RA. Origins of HIV and the evolution of resistance to AIDS. Science. 2006;313:462–466. - PubMed
Publication types
MeSH terms
Substances
Grants and funding
- R01 AI44480/AI/NIAID NIH HHS/United States
- P51RR000166/RR/NCRR NIH HHS/United States
- K01 AI066917/AI/NIAID NIH HHS/United States
- AI076014/AI/NIAID NIH HHS/United States
- T32 DK007762/DK/NIDDK NIH HHS/United States
- R24 RR016354/RR/NCRR NIH HHS/United States
- AI066917/AI/NIAID NIH HHS/United States
- P51 RR000169/RR/NCRR NIH HHS/United States
- U51RR00169/RR/NCRR NIH HHS/United States
- K24 DK060617/DK/NIDDK NIH HHS/United States
- R24RR016354/RR/NCRR NIH HHS/United States
- DPI OD00329/OD/NIH HHS/United States
- N01AI30018/AI/NIAID NIH HHS/United States
- P01 AI066314/AI/NIAID NIH HHS/United States
- P51 RR000166/RR/NCRR NIH HHS/United States
- P30 DA015625/DA/NIDA NIH HHS/United States
- DP1 OD000329/OD/NIH HHS/United States
- P30DA015625/DA/NIDA NIH HHS/United States
- R21 AI076014/AI/NIAID NIH HHS/United States
LinkOut - more resources
Full Text Sources
Other Literature Sources

