. 2009 May;16(5):684-96.
doi: 10.1038/cdd.2008.195. Epub 2009 Jan 16.

Puma and to a lesser extent Noxa are suppressors of Myc-induced lymphomagenesis

Affiliations

Puma and to a lesser extent Noxa are suppressors of Myc-induced lymphomagenesis

E M Michalak et al. Cell Death Differ. 2009 May.

Abstract

Evasion of apoptosis contributes importantly to c-Myc-induced tumorigenesis. The BH3-only Bcl-2 family members Puma and Noxa are critical pro-apoptotic transcriptional targets of p53, a major mediator of Myc-induced apoptosis and suppressor of Myc-induced tumorigenesis. Hence, we have explored the impact of their individual or combined loss on myc-driven lymphomagenesis. Notably, Puma deficiency both increased B-lineage cells and accelerated the development of B lymphoma, accompanied by leukaemia, but not of pre-B lymphoma. Noxa deficiency alone also increased B-lineage cells but did not accelerate lymphomagenesis. However, its deficiency combined with loss of one puma allele produced more rapid onset of both pre-B and B lymphomas than did loss of a single puma allele alone. Nevertheless, the acceleration evoked by loss of both genes was not as marked as that caused by p53 heterozygosity. These results show that Puma imposes a significant, and Noxa a minor barrier to c-Myc-driven lymphomagenesis. They also indicate that additional BH3-only proteins probably also drive Myc-induced apoptosis and that non-apoptotic functions of p53 may contribute substantially to its tumour suppressor role.


Conflict of interest statement

Conflict of interest/disclosure: The authors declare no competing financial interests.

Figures

Figure 1
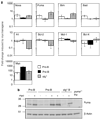
Figure 1. Puma and Noxa expression is increased in B cells from Eμ-myc mice
(a) Differences in the levels of RNA for Bcl-2 family members and Myc between cells from Eμ-myc and non-transgenic mice. Pro-B, pre-B and B-cell subsets were FACS purified from healthy 5- to 6-week-old Eμ-myc or non-transgenic syngeneic (C57BL/6) mice. SYBR green real-time PCR analysis was performed on cDNA. Relative RNA expression levels were calculated by normalising to the signal for β-actin in each sample and then dividing the transgenic by the non-transgenic value. Mean expression is shown ± S.E.M. of cells from 3–4 individual mice of each genotype from at least three separate experiments. (b) Western blot analysis of Puma and β-actin (loading control) on protein isolated from the cell populations described in A. Puma-deficient thymocytes were included as a control for antibody specificity. Protein size standards in kDa are indicated on the left
Figure 2
Figure 2. In pre-neoplastic Eμ-myc mice, loss of Puma increases leukocytes and B-lymphoid cells
(a) White blood cell counts (means ± S.E.M.) from pre-neoplastic 4-week-old mice of the indicated Eμ-myc and puma genotypes. Differences between transgenic genotypes were significant as indicated. (b) Blood cellularity and subset composition in pre-neoplastic 5- to 6-week-old mice of the indicated genotypes. All differences between non-transgenic and Eμ-myc mice were significant for all puma genotypes (P<0.05) except for mature B cells from non-transgenic versus Eμ-myc/puma−/− mice. For comparisons of Eμ-myc transgenic mice of the different puma genotypes, statistically significant differences in addition to those indicated, included all subset comparisons between Eμ-myc/puma+/− and Eμ-myc/puma−/− mice. (c) Spleen weights (means ± S.E.M.) of pre-neoplastic 5- to 6-week-old mice. Differences between non-transgenic and Eμ-myc mice were significant for all puma genotypes (P<0.03), and for those indicated. (d) Bone marrow cellularity (both femora) and subset composition in pre-neoplastic 5- to 6-week-old mice of the indicated genotypes. Differences between non-transgenic and Eμ-myc mice were significant (P<0.05) for all puma genotypes for total B and pre-B cell comparisons and for reduction in mature B cells for wt versus Eμ-myc and wt versus Eμ-myc/puma−/− mice. For comparisons of the Eμ-myc transgenic mice of the different puma genotypes, all statistically significant differences are indicated. Values represent means ± S.E.M. from 4 to 8 mice of each genotype. *P<0.05, **P<0.01, ***P<0.005
Figure 3
Figure 3. Loss of Puma enhances survival of Eμ-myc pre-B cells in culture
Pre-B cells sorted from the bone marrow of 5- to 6-week-old pre-neoplastic wt or Eμ-myc mice of the indicated puma genotypes were cultured in simple medium (no added cytokines) or treated with etoposide (1 µg/ml) for the indicated times. The percentages of viable Eμ-myc/puma−/− pre-B cells remaining in culture at 24 and 48 h were significantly greater than for Eμ-myc pre-B cells (P<0.01 and P<0.001, respectively). A similar protection was observed for Eμ-myc/puma−/− pre-B cells after 4 h in culture with etoposide, compared with Eμ-myc pre-B cells (P<0.02). Values represent means ± S.E.M. of cells from 3 to 6 independent experiments for each genotype
Figure 4
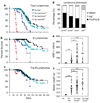
Figure 4. Loss of Puma accelerates lymphoma development in Eμ-myc transgenic mice
(a) Kaplan–Meier analysis of tumour-free survival of mice of the indicated genotypes. Lymphomas arose earlier in Eμ-myc/puma−/− mice than in Eμ-myc or Eμ-myc/puma+/− mice (P<0.001). Differences in tumour onset between Eμ-myc and Eμ-myc/puma+/− mice were not significant (P=0.46). (b) B lymphomas arose earlier in Eμ-myc/puma−/− mice than Eμ-myc or Eμ-myc/puma+/− mice (P<0.001). (c) Pre-B lymphoma development was not accelerated in Eμ-myc mice by loss of one or both puma alleles. (d) Proportions of pro-B/pre-B, mixed and sIg+ lymphomas in ill Eμ-myc, Eμ-myc/puma+/−, Eμ-myc/puma−/− (P=0.07, trend analysis) and Eμ-myc/p53+/− mice. (e) Numbers of leukocytes (white blood cells: WBC) in the blood of control (healthy) 102-day-old wt C57BL/6 mice and sick Eμ-myc mice of the indicated puma genotypes. Each circle represents a single animal. Bars represent mean leukocyte counts. Numbers of C57BL/6, Eμ-myc, Eμ-myc/puma+/− and Eμ-myc/puma−/− mice were 10, 33, 54 and 18, respectively. (f) Spleen weights of control 102-day-old (healthy) wt C57BL/6 mice and sick Eμ-myc mice of the indicated puma genotypes. Bars represent means. Numbers of C57BL/6, Eμ-myc, Eμ-myc/puma+/− and Eμ-myc/puma−/− mice were 10, 34, 65 and 21, respectively. **P<0.01, ***P<0.005
Figure 5
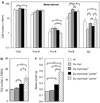
Figure 5. Loss of Noxa did not further augment the elevated leukocytes in pre-malignant Eμ-myc mice lacking one or both puma alleles
(a) Bone marrow cellularity (both femora) and cell subset composition of pre-neoplastic 5- to 6-week-old mice of the indicated genotypes. Values represent means ± S.E.M. from 5 to 8 mice of each genotype. All differences between non-transgenic and Eμ-myc mice were significant (P<0.05) for total B cells and pre-B cells; as were comparisons of total B cells and pro-B cells for wt versus Eμ-myc/noxa−/− mice and for mature B cells for wt versus Eμ-myc and for wt versus Eμ-myc/noxa−/−puma+/− mice. For comparisons of Eμ-myc transgenic mice of the different noxa and puma genotypes, statistically significant differences are indicated. (b) White blood cell counts (means ± S.E.M.) of pre-neoplastic 4 week-old mice of the indicated genotypes. Numbers of Eμ-myc, Eμ-myc/noxa−/−, Eμ-myc/noxa−/−puma+/− mice and Eμ-myc/noxa−/−puma−/− mice were 31, 31, 32 and 14, respectively. (c) Spleen weights of pre-neoplastic 5- to 6-week-old mice. For B and C, differences between transgenic genotypes were significant as indicated. Values represent means ± S.E.M. from 5 to 8 mice of each genotype. *P<0.05, **P<0.01, ***P<0.005
Figure 6
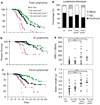
Figure 6. Loss of Noxa accelerates lymphoma development in Eμ-myc/puma+/− mice
(a) Kaplan–Meier analysis of tumour-free survival of mice of the indicated genotypes. Lymphomas developed earlier in Eμ-myc/noxa−/−puma−/− (n=11) than Eμ-myc/noxa−/−puma+/− (n=29) mice (P<0.04) and both arose earlier than in Eμ-myc mice (n=64) (P<0.0001). (b) B lymphomas arose earlier in Eμ-myc/noxa−/−puma+/− than Eμ-myc/puma+/− mice (compare with Figure 4; P<0.01). (c) Pre-B lymphomas arose later in Eμ-myc/noxa−/− than Eμ-myc mice (P<0.05) but earlier in Eμ-myc/noxa−/−puma+/− than in Eμ-myc/puma+/− mice (P<0.01). Eμ-myc/noxa−/−puma−/− mice succumbed earlier than Eμ-myc/puma−/− mice (compare to Figure 4c; P<0.02). (d) The proportions of pre-B, sIg+ and mixed pre-B/B-cell lymphomas arising in Eμ-myc/puma+/− and Eμ-myc/puma−/− were not affected by additional loss of Noxa. (e) White blood cell numbers in sick Eμ-myc mice of the indicated noxa and puma genotypes. Each circle represents a single animal. Bars indicate means. Numbers of Eμ-myc, Eμ-myc/noxa−/−, Eμ-myc/noxa−/−puma+/− mice and Eμ-myc/noxa−/−puma−/− mice were 33, 20, 23 and 10, respectively. (f) Spleen weights of sick mice of the indicated genotypes. Bars indicate means. Numbers of Eμ-myc, Eμ-myc/noxa−/−, Eμ-myc/noxa−/−puma+/− mice and Eμ-myc/noxa−/−puma−/− mice were 34, 21, 22 and 10, respectively. *P<0.05, ***P<0.005
Figure 7
Figure 7. Tumours from Eμ-myc/noxa−/−puma+/− mice retain the wt puma allele but some exhibit reduced levels of Puma expression
Allele-specific PCR for retention of the residual wt puma allele was performed on (a) 12 randomly selected tumours from Eμ-myc/noxa−/−puma+/− mice and (b) lymphoma cells sorted from four Eμ-myc/noxa−/−puma+/− mice based on large forward scatter and staining for B220. The wt and knockout puma alleles are 203 and 376 bp, respectively. A positive control for puma heterozygosity (+ve) and a no-DNA control (−ve) were included. (c) Western blot analysis of Puma and β-actin (loading control) in randomly selected Eμ-myc/noxa−/−puma+/− tumours. One Eμ-myc/noxa−/−puma+/− tumour (no. 33) is repeated as a loading control alongside two tumours (PM211, PM291) from Eμ-myc/puma−/− mice, in which no Puma could be detected. The anti-Puma antibody also detects a non-specific band (ns). Protein size standards in kDa are indicated on the left
Figure 8
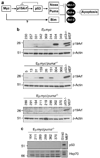
Figure 8. Model for Myc-induced apoptosis and detection of alterations in the p53 pathway
(a) The diagram depicts two pathways by which Myc engages the core apoptotic machinery, one through p19Arf, p53 and Puma and Noxa, and the other through Bim (modified from Egle et al.10). Western blot analysis of (b) p19Arf and β-actin (loading control), or (c) p53, and Hsp70 (loading control) in randomly selected Eμ-myc lymphomas of the indicated puma genotypes. p53−/− mouse embryonic fibroblasts (MEF) or MEF immortalised with SV40 large T antigen, were included as positive controls for p19Arf overexpression and p53 overexpression, respectively. In (c) the MEF control was run on the same gel but a lane not required was spliced out of this gel. Protein size standards in kDa are indicated on the left

Similar articles

Cited by

References

    1. Vousden KH, Lu X. Live or let die: the cell’s response to p53. Nat Rev Cancer. 2002;2:594–604. - PubMed
    1. Kastan MB. Wild-type p53: tumors canșt stand it. Cell. 2007;128:837–840. - PubMed
    1. Wang Y, Szekely L, Okan I, Klein G, Wiman KG. Wild-type p53-triggered apoptosis is inhibited by bcl-2 in a v-myc-induced T-cell lymphoma line. Oncogene. 1993;8:3427–3431. - PubMed
    1. Strasser A, Harris AW, Cory S. Bcl-2 transgene inhibits T cell death and perturbs thymic self-censorship. Cell. 1991;67:889–899. - PubMed
    1. Strasser A, Harris AW, Jacks T, Cory S. DNA damage can induce apoptosis in proliferating lymphoid cells via p53-independent mechanisms inhibitable by Bcl-2. Cell. 1994;79:329–339. - PubMed

Publication types

MeSH terms

Substances