IL-10 and PD-L1 operate through distinct pathways to suppress T-cell activity during persistent viral infection
- PMID: 19075244
- PMCID: PMC2629263
- DOI: 10.1073/pnas.0811139106
IL-10 and PD-L1 operate through distinct pathways to suppress T-cell activity during persistent viral infection
Abstract
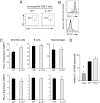
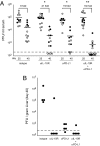
Suppression of T-cell responses by host-derived regulatory factors is a key event leading to viral persistence. Antibody blockade of either IL-10 or programmed death-ligand 1 (PD-L1) during viral persistence enhances T-cell function and reduces viral titers. Because blockade of these immunoregulatory networks represents a powerful approach to establish immune control during persistent infection, it is important to determine whether these immunoinhibitory factors act independently or jointly and if combined blockade of these factors further enhances T-cell immunity and viral clearance. Herein, we demonstrate that the IL-10 and PD-L1 immunosuppressive pathways are mechanistically distinct. As a result, simultaneous blockade of IL-10 and PD-L1 was significantly more effective in restoring antiviral T-cell responses than blockade of either alone, and led to substantially enhanced control of an established persistent viral infection. Thus, combinatorial blockade of multiple immune-regulatory molecules may ultimately restore the T-cell responses required to tip the balance from viral persistence to immune-mediated control or elimination of persistent infection.
Conflict of interest statement
The authors declare no conflict of interest.
Figures


Similar articles
-
A Jekyll and Hyde Profile: Type 1 Interferon Signaling Plays a Prominent Role in the Initiation and Maintenance of a Persistent Virus Infection.J Infect Dis. 2015 Jul 15;212 Suppl 1(Suppl 1):S31-6. doi: 10.1093/infdis/jiu501. J Infect Dis. 2015. PMID: 26116728 Free PMC article.
-
Analysis of the role of negative T cell costimulatory pathways in CD4 and CD8 T cell-mediated alloimmune responses in vivo.J Immunol. 2005 Jun 1;174(11):6648-56. doi: 10.4049/jimmunol.174.11.6648. J Immunol. 2005. PMID: 15905503
-
Immune responses against persistent viral infections: possible avenues for immunotherapeutic interventions.Crit Rev Immunol. 2008;28(2):159-83. doi: 10.1615/critrevimmunol.v28.i2.40. Crit Rev Immunol. 2008. PMID: 18540829 Review.
-
IL-10 blockade facilitates DNA vaccine-induced T cell responses and enhances clearance of persistent virus infection.J Exp Med. 2008 Mar 17;205(3):533-41. doi: 10.1084/jem.20071948. Epub 2008 Mar 10. J Exp Med. 2008. PMID: 18332180 Free PMC article.
-
Therapeutic intervention in cancer and chronic viral infections: antibody mediated manipulation of PD-1/PD-L1 interaction.Rev Recent Clin Trials. 2012 Feb;7(1):10-23. doi: 10.2174/157488712799363262. Rev Recent Clin Trials. 2012. PMID: 22023178 Review.
Cited by
-
Role of TLR2-dependent IL-10 production in the inhibition of the initial IFN-γ T cell response to Porphyromonas gingivalis.J Leukoc Biol. 2013 Jan;93(1):21-31. doi: 10.1189/jlb.0512220. Epub 2012 Oct 17. J Leukoc Biol. 2013. PMID: 23077245 Free PMC article.
-
IFN-λ exerts opposing effects on T cell responses depending on the chronicity of the virus infection.J Immunol. 2014 Apr 15;192(8):3596-606. doi: 10.4049/jimmunol.1301705. Epub 2014 Mar 19. J Immunol. 2014. PMID: 24646741 Free PMC article.
-
T Cell Dysfunction and Exhaustion in Cancer.Front Cell Dev Biol. 2020 Feb 11;8:17. doi: 10.3389/fcell.2020.00017. eCollection 2020. Front Cell Dev Biol. 2020. PMID: 32117960 Free PMC article. Review.
-
ICAM-1-dependent homotypic aggregates regulate CD8 T cell effector function and differentiation during T cell activation.J Immunol. 2013 Oct 1;191(7):3681-93. doi: 10.4049/jimmunol.1201954. Epub 2013 Aug 30. J Immunol. 2013. PMID: 23997225 Free PMC article.
-
Anti-inflammatory cytokines directly inhibit innate but not adaptive CD8+ T cell functions.J Virol. 2014 Jul;88(13):7474-84. doi: 10.1128/JVI.00658-14. Epub 2014 Apr 16. J Virol. 2014. PMID: 24741101 Free PMC article.
References
-
- Gallimore A, Dumrase T, Hengartner H, Zinkernagel RM, Rammansee HG. Induction and exhaustion of lymphocytic choriomeningitis virus-specific cytotoxic T lymphocytes visualized using soluble tetrameric major histocompatibility complex class I-peptide complexes. J Exp Med. 1998;187:1383–1393. - PMC - PubMed
-
- Oldstone MB, Blount P, Southern PJ, Lampert PW. Cytoimmunotherapy for persistent virus infection reveals a unique clearance pattern from the central nervous system. Nature. 1986;321:239–243. - PubMed
Publication types
MeSH terms
Substances
Grants and funding
LinkOut - more resources
Full Text Sources
Other Literature Sources
Medical
Research Materials

