. 2008 Nov 13;4(5):470-83.
doi: 10.1016/j.chom.2008.09.012.

Toll-like receptor 4 mediates innate immunity to Kaposi sarcoma herpesvirus

Affiliations

Toll-like receptor 4 mediates innate immunity to Kaposi sarcoma herpesvirus

Dimitrios Lagos et al. Cell Host Microbe. .

Abstract

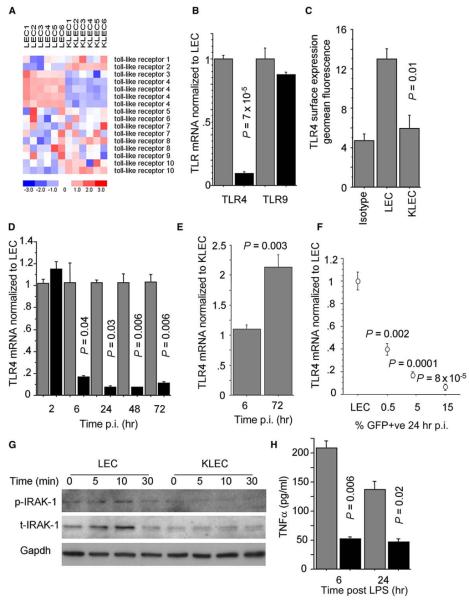
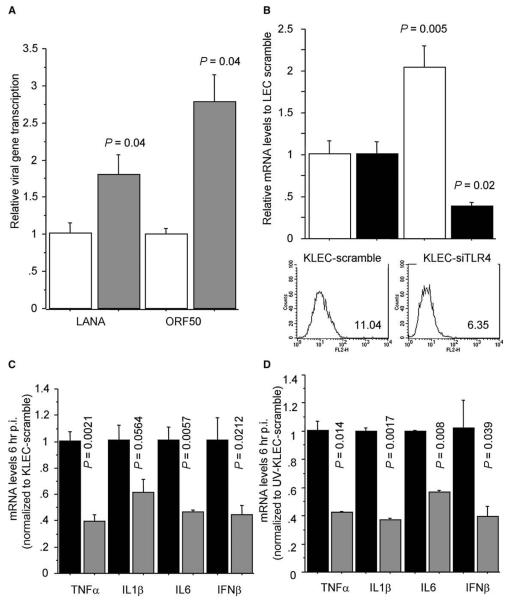
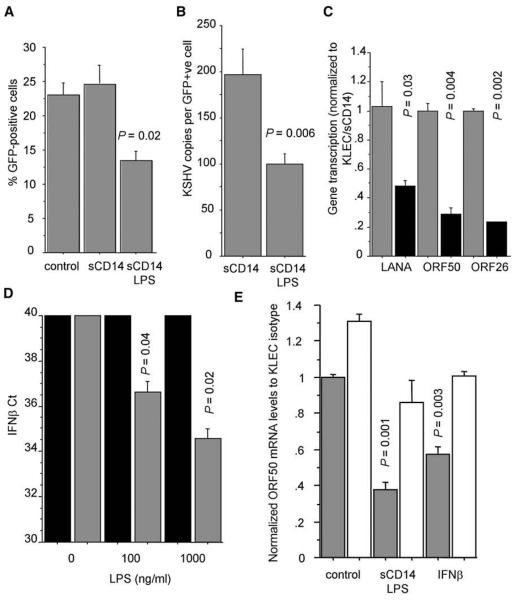
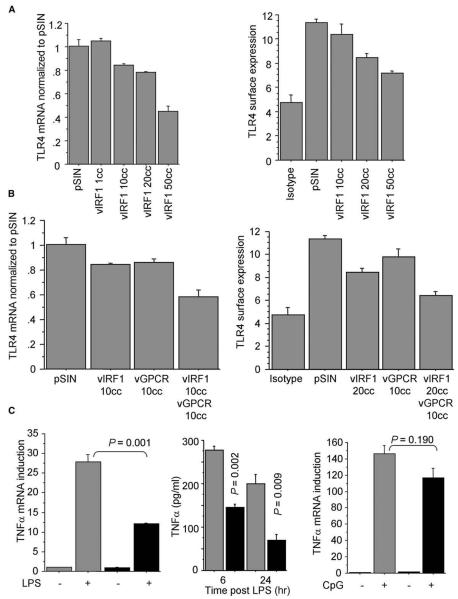
The involvement of Toll-like receptor 4 (TLR4) in immunity against human herpesviruses has not been previously demonstrated. We show that infection of endothelial cells with Kaposi sarcoma herpesvirus (KSHV), a human oncogenic virus, leads to rapid suppression of TLR4 expression. This is a mechanism of immune escape as TLR4 mediates innate immunity against KSHV. In vitro, cells lacking TLR4 are more susceptible to KSHV infection, whereas activation of TLR4 protects cells from infection. In vivo, HIV-1-infected individuals carrying a mutant TLR4 allele appear more likely to have multicentric Castleman's disease, a lymphoproliferation associated with enhanced KSHV replication. ERK activation by KSHV structural proteins and the KSHV-encoded vGPCR plays a key role in the TLR4 downregulation, whereas the KSHV vIRF1 also contributes to this effect. Our findings reveal a role for TLR4 in innate immunity against herpesviruses and suggest the potential use of TLR4 agonists for the treatment of KSHV-related neoplasms.


Figures

Figure 1
Figure 1. KSHV Suppresses TLR4 Expression
(A) Heatmap of TLR expression in LEC and KSHV-infected LEC (KLEC; 72 hr p.i.), based on GEM profiling. Rows correspond to TLR probe sets. Red and blue denote high and low expression respectively, the color scale indicating units of standard deviation from the mean. (B) TLR4 and TLR9 mRNA levels in LEC (gray bars) and KLEC (black bars) 72 hr p.i. (C) Surface TLR4 expression in LEC and GFP-expressing KLEC (72 hr p.i.). (D) Time course of TLR4 mRNA levels in LEC (gray bars) and KLEC (black bars). For each time point, mRNA levels are normalized to LEC TLR4 mRNA levels. (E) TLR4 mRNA levels in LEC infected with UV-inactivated KSHV normalized to KLEC TLR4 mRNA at 6 hr and 72 hr p.i. P value between UV-inactivated samples and KLEC is shown. (F) TLR4 mRNA levels in relation to percentage of GFP-expressing KLEC (24 hr p.i.). Values normalized to LEC and P values shown. (G) Levels of phosphorylated and total IRAK1 (p-IRAK1 and t-IRAK1, respectively) following stimulation of LEC and KLEC (72 hr p.i.) with 100ng/ml LPS/1 μg/ml sCD14 for the indicated time. GAPDH levels are shown as loading controls. Note that the increase of the t-IRAK1 signal in LEC following LPS stimulation represents an increase in the activated form of the protein rather than an increase in the total protein levels (Hatao et al., 2004). (H) Levels of secreted TNF-α following stimulation of LEC (gray bars) and KLEC (black bars; 72 hr p.i.) with LPS/sCD14 for 6 hr and 24 hr. For (B)–(D) and (H), P values between KLEC and LEC, samples are shown. In all panels, error bars represent standard deviation.
Figure 2
Figure 2. Increased Susceptibility of Cells Lacking TLR4 to KSHV Infection
(A) mRNA levels of KSHV-encoded LANA-1 and ORF50 transcripts after KSHV infection (48 hr p.i.) of peritoneal macrophages from C57BL10/ScSnJ mice (wild-type, white bars) and C57BL10/ScNJ mice (Tlr4−/−, gray bars). Levels normalized to average gene expression in KSHV-infected C57BL10/ScSnJ macrophages. P values indicate statistical significance of changes between C57BL10/ScNJ and C57BL10/ScSnJ macrophages. (B) LANA-1 mRNA levels (white bars) in KLEC (48 hr p.i.). LEC were transfected with nontargeting siRNA (KLEC scramble) or TLR4-targeting siRNA (KLEC-siTLR4) 48 hr before KSHV infection. TLR4 surface expression (histograms; TLR4 geometrical mean fluorescence shown) and mRNA levels (black bars) were determined 48 hr post siRNA transfection. mRNA levels are normalized to KLEC-scramble levels. (C) TNF-α, IL1-β, IL-6, and IFN-β mRNA levels 6 hr after KSHV infection of KLEC scramble (black bars) or KLEC-siTLR4 (gray bars). Levels are normalized to KLEC scramble. (D) As in (C), but after exposure of LEC to UV-inactivated KSHV. In (B)–(D), P values indicate statistical significance of changes between mRNA levels in KLEC scramble and KLEC-siTLR4. In all panels, error bars represent standard deviation.
Figure 3
Figure 3. TLR4 Activation by LPS Protects LEC from KSHV Infection
(A) Percentage of GFP-expressing cells in KLEC, KLEC pretreated with sCD14 (1 μg/ml), and KLEC pretreated with sCD14 (1 μg/ml) and LPS (100 ng/ml). (B) Average number of KSHV genomes per GFP-expressing cell. Cells were pretreated as described in (A). (C) mRNA levels of KSHV latent, immediate lytic, and late lytic genes (LANA, ORF50, and ORF26, respectively) in KLEC pretreated with sCD14 (gray bars) or sCD14 and LPS (black). Levels are normalized to sCD14 pretreated KLEC. In (A)–(C), P values between KLEC pretreated with sDC14 and sCD14/LPS are shown, and experiments are performed 72 hr p.i. (D) IFN-β expression in LEC treated with PBS (black bars) or 1 μg/ml sCD14 (gray bars) and varying amounts of LPS (x axis) for 6 hr. Ct values (y axis) indicate cycle number when PCR products become detectable. Samples are normalized for GAPDH Ct. P values between PBS/LPS- and sCD14/LPS-treated LEC for each LPS concentration are shown. (E) ORF50 mRNA levels in KLEC and in KLEC pre-treated with sCD14 and LPS or IFN-β (1000U/ml) in the presence of an IFNaRII neutralizing antibody (white bars) or an isotype control (gray bars). IFN-β treatment was used to assess the neutralizing efficiency of the antibody. P values indicate significant changes compared with to KLEC control. In all panels, error bars represent standard deviation.
Figure 4
Figure 4. Increased Susceptibility of LEC-TLR4A/G to KSHV Infection
(A) TLR4 expression in LEC-TLR4A/A (wild-type TLR4) and LEC-TLR4A/G (heterozygous mutation in TLR4 gene). Inserts show the corresponding pyrograms showing a 50% loss of the fourth peak (corresponding to A) and 50% increase of the third peak (corresponding to a G) in the mutant cells. Bar graph shows mRNA levels of TLR4 and TLR9 in LEC-TLR4A/A (gray bars) and LEC-TLR4A/G (black bars). (B) mRNA levels of inflammatory cytokines and IFN-β in LEC-TLR4A/A (gray bars) and LEC-TLR4A/G (black bars) 6 hr poststimulation with LPS/sCD14. P values indicate significant changes compared to LEC-TLR4A/A. mRNA levels are corrected for background transcription (in nonstimulated LEC). (C) Representative dot plot of KSHV infected LEC-TLR4A/A and LEC-TLR4A/G. Numbers correspond to percentage of infected cells. (D) KSHV gene expression in KLEC-TLR4A/A (gray bars) and KLEC-TLR4A/G (black bars) 72 hr p.i. P values indicate significant changes compared to KLEC-TLR4A/A. In all panels, error bars represent standard deviation.
Figure 5
Figure 5. Association of TLR4 SNP with MCD
(A) TLR4 SNP map of 109 HIV-1-infected individuals. PN, patient number, DS, disease status (black, MCD and KS; dark gray, MCD; light gray, KS; white, other), A/G, Asp299Gly, and C/T, Ile399Thr. Red and green boxes indicate presence of the corresponding SNP. (B) Clinical characteristics and SNP incidence in the studied cohort. P values are calculated with Fischer Exact Probability Test. (C) Box plot of plasma KSHV load at time of diagnosis in individuals with MCD (with or without KS) and KS only (available for 16 participants with KS only). Boxes indicate the lower and upper quartiles, and the line indicates the median viral load for each group. The ends of the lines outside the boxes indicate minimum and maximum loads, whereas circles represent outliers. Median and range of each group are also shown on top of each box. P value between the two groups is also shown.
Figure 6
Figure 6. vIRF1 and vGPCR Contribute to the Downregulation of TLR4
(A) TLR4 mRNA and surface expression (geometrical mean fluorescence) levels in LEC expressing increasing amounts of vIRF1 (shown as average number of lentiviral copies per cell, cc) and empty lentiviral vector (pSIN). Levels normalized to LEC-pSIN. (B) TLR4 mRNA and surface expression levels in LEC expressing pSIN, vIRF1, vGPCR, and vIRF1 and vGPCR. (C) Fold mRNA TNF-α induction and TNF-α secreted levels in LEC-expressing vIRF1 and vGPCR (black bars) or pSIN (gray bars) after stimulation with LPS/sCD14 and fold mRNA TNF-α induction after stimulation with CpG DNA. P values between stimulated LEC-pSIN and LEC-vIRF1/vGPCR are shown. For all panels, experiments were performed 72 hr p.i. In all panels, error bars represent standard deviation.
Figure 7
Figure 7. ERK Activation Contributes to TLR4 Downregulation in KLEC
(A) TLR4 mRNA levels in LEC-pSIN (black bar) and LEC-expressing vGPCR (gray bars) after treatment with the chemical inhibitors LY294002 (LY), BAY11-7082 (BAY), SB202190 (SB), JNK inhibitor II (JNK), PD98059 (PD), and UO126 (UO). Controls were treated with 0.1% DMSO. (B) TLR4 mRNA levels in LEC-pSIN (black bar) and LEC-vGPCR (gray bars) after treatment with DMSO, 1 μM and 10 μM of UO126. Inset shows protein levels of phosphorylated and total ERK in LEC-pSIN and LEC-vGPCR. For (A) and (B), levels are normalized to LEC-pSIN/0.1% DMSO. (C) TLR4 expression in LEC-pSIN (black bars) and LEC-vGPCR (72 hr p.i., gray bars). LEC were transfected with nontargeting siRNA (scramble) or siRNAs targeting ERK1 and ERK2 (siERK) 48 hr before infection with pSIN or vGPCR lentivirus. Inset shows levels of ERK1 (top band) and ERK2 (bottom band) in scramble and siERK LEC (48 hr posttransfection). Significant P values between LEC-pSIN and LEC-vGPCR are shown. Bar graph shows levels of ERK1 and ERK2 in LEC-siERK compared to LEC-scramble 48 hr posttransfection. (D) TLR4 expression in LEC (black bars) and KLEC (72 hr p.i., gray bars) after treatment of cells with DMSO, SB202190, JNK inhibitor II, UO126, PD98059, or LY294002. P values indicate statistical significance of changes between KLEC-DMSO and KLEC-UO or KLEC-PD. Inset shows protein levels of phosphorylated and total ERK in LEC-DMSO, KLEC-DMSO, and KLEC treated with UO126 MEK-inhibitor. P values indicate statistically significant changes between LEC-DMSO and KLEC samples. (E) TLR4 expression in LEC (black bars) and KLEC (6 hr p.i., gray bars) after treatment with DMSO (control for chemical inhibitors) or media (control for antioxidants), N-acetyl-cysteine and ascorbic acid (anti-oxidants), LY294002, and UO126. TLR9 mRNA levels in LEC-DMSO, KLEC-DMSO, and KLEC treated with UO126 (6 hr p.i.). (F) TLR4 expression in LEC (black bars) and KLEC (6 hr p.i., gray bars). Cells were transfected with nontargeting siRNA (scramble) or siRNAs targeting ERK1 and ERK2 (siERK) 48 hr before infection with KSHV. P values indicate significant changes between LEC and KLEC. In all panels, error bars represent standard deviation.

Similar articles

Cited by

References

    1. Akira S, Uematsu S, Takeuchi O. Pathogen recognition and innate immunity. Cell. 2006;124:783–801. - PubMed
    1. An H, Yu Y, Zhang M, Xu H, Qi R, Yan X, Liu S, Wang W, Guo Z, Guo J, et al. Involvement of ERK, p38 and NF-kappaB signal transduction in regulation of TLR2, TLR4 and TLR9 gene expression induced by lipopolysaccharide in mouse dendritic cells. Immunology. 2002;106:38–45. - PMC - PubMed
    1. Apetoh L, Ghiringhelli F, Tesniere A, Obeid M, Ortiz C, Criollo A, Mignot G, Maiuri MC, Ullrich E, Saulnier P, et al. Toll-like receptor 4-dependent contribution of the immune system to anticancer chemotherapy and radiotherapy. Nat. Med. 2007;13:1050–1059. - PubMed
    1. Boivin G, Cote S, Cloutier N, Abed Y, Maguigad M, Routy JP. Quantification of human herpesvirus 8 by real-time PCR in blood fractions of AIDS patients with Kaposi's sarcoma and multicentric Castleman's disease. J. Med. Virol. 2002;68:399–403. - PubMed
    1. Boshoff C, Weiss R. AIDS-related malignancies. Nat. Rev. Cancer. 2002;2:373–382. - PubMed

Publication types

MeSH terms