In vitro identification and characterization of CD133(pos) cancer stem-like cells in anaplastic thyroid carcinoma cell lines
- PMID: 18958156
- PMCID: PMC2568821
- DOI: 10.1371/journal.pone.0003544
In vitro identification and characterization of CD133(pos) cancer stem-like cells in anaplastic thyroid carcinoma cell lines
Abstract
Background: Recent publications suggest that neoplastic initiation and growth are dependent on a small subset of cells, termed cancer stem cells (CSCs). Anaplastic Thyroid Carcinoma (ATC) is a very aggressive solid tumor with poor prognosis, characterized by high dedifferentiation. The existence of CSCs might account for the heterogeneity of ATC lesions. CD133 has been identified as a stem cell marker for normal and cancerous tissues, although its biological function remains unknown.
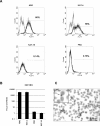
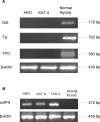
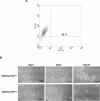
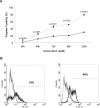
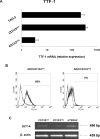
Methodology/principal findings: ATC cell lines ARO, KAT-4, KAT-18 and FRO were analyzed for CD133 expression. Flow cytometry showed CD133(pos) cells only in ARO and KAT-4 (64+/-9% and 57+/-12%, respectively). These data were confirmed by qRT-PCR and immunocytochemistry. ARO and KAT-4 were also positive for fetal marker oncofetal fibronectin and negative for thyrocyte-specific differentiating markers thyroglobulin, thyroperoxidase and sodium/iodide symporter. Sorted ARO/CD133(pos) cells exhibited higher proliferation, self-renewal, colony-forming ability in comparison with ARO/CD133(neg). Furthermore, ARO/CD133(pos) showed levels of thyroid transcription factor TTF-1 similar to the fetal thyroid cell line TAD-2, while the expression in ARO/CD133(neg) was negligible. The expression of the stem cell marker OCT-4 detected by RT-PCR and flow cytometry was markedly higher in ARO/CD133(pos) in comparison to ARO/CD133(neg) cells. The stem cell markers c-KIT and THY-1 were negative. Sensitivity to chemotherapy agents was investigated, showing remarkable resistance to chemotherapy-induced apoptosis in ARO/CD133(pos) when compared with ARO/CD133(neg) cells.
Conclusions/significance: We describe CD133(pos) cells in ATC cell lines. ARO/CD133(pos) cells exhibit stem cell-like features--such as high proliferation, self-renewal ability, expression of OCT-4--and are characterized by higher resistance to chemotherapy. The simultaneous positivity for thyroid specific factor TTF-1 and onfFN suggest they might represent putative thyroid cancer stem-like cells. Our in vitro findings might provide new insights for novel therapeutic approaches.
Conflict of interest statement
Figures


Similar articles
-
Cancer stem-like cell behavior in anaplastic thyroid cancer: A challenging dilemma.Life Sci. 2016 Feb 1;146:34-9. doi: 10.1016/j.lfs.2015.12.057. Epub 2016 Jan 7. Life Sci. 2016. PMID: 26772823
-
Targeting signal transducer and activator of transcription 3 pathway by cucurbitacin I diminishes self-renewing and radiochemoresistant abilities in thyroid cancer-derived CD133+ cells.J Pharmacol Exp Ther. 2012 May;341(2):410-23. doi: 10.1124/jpet.111.188730. Epub 2012 Feb 10. J Pharmacol Exp Ther. 2012. PMID: 22328572
-
Thyroid cancer stem-like cells and epithelial-mesenchymal transition in thyroid cancers.Hum Pathol. 2013 Sep;44(9):1707-13. doi: 10.1016/j.humpath.2013.01.009. Epub 2013 Mar 22. Hum Pathol. 2013. PMID: 23528862
-
Research progression of CD133 as a marker of cancer stem cells.Chin J Cancer. 2010 Mar;29(3):243-7. doi: 10.5732/cjc.009.10587. Chin J Cancer. 2010. PMID: 20193104 Review.
-
CD133 as a marker for cancer stem cells: progresses and concerns.Stem Cells Dev. 2009 Oct;18(8):1127-34. doi: 10.1089/scd.2008.0338. Stem Cells Dev. 2009. PMID: 19409053 Review.
Cited by
-
Expression of epithelial-mesenchymal transition regulators SNAI2 and TWIST1 in thyroid carcinomas.Mod Pathol. 2013 Jan;26(1):54-61. doi: 10.1038/modpathol.2012.137. Epub 2012 Aug 17. Mod Pathol. 2013. PMID: 22899291 Free PMC article.
-
Thyroid Cancer Stem-Like Cells: From Microenvironmental Niches to Therapeutic Strategies.J Clin Med. 2021 Apr 1;10(7):1455. doi: 10.3390/jcm10071455. J Clin Med. 2021. PMID: 33916320 Free PMC article. Review.
-
CD133/Src axis mediates tumor initiating property and epithelial-mesenchymal transition of head and neck cancer.PLoS One. 2011;6(11):e28053. doi: 10.1371/journal.pone.0028053. Epub 2011 Nov 28. PLoS One. 2011. PMID: 22140506 Free PMC article.
-
miR-200a regulates epithelial-mesenchymal to stem-like transition via ZEB2 and beta-catenin signaling.J Biol Chem. 2010 Nov 19;285(47):36995-7004. doi: 10.1074/jbc.M110.133744. Epub 2010 Sep 7. J Biol Chem. 2010. PMID: 20826811 Free PMC article.
-
Illuminating the role of lncRNAs ROR and MALAT1 in cancer stemness state of anaplastic thyroid cancer: An exploratory study.Noncoding RNA Res. 2023 May 26;8(3):451-458. doi: 10.1016/j.ncrna.2023.05.006. eCollection 2023 Sep. Noncoding RNA Res. 2023. PMID: 37455764 Free PMC article.
References
-
- AACE/AME Task Force on Thyroid Nodules American Association of Clinical Endocrinologists and Associazione Medici Endocrinologi medical guidelines for clinical practice for the diagnosis and management of thyroid nodules. Endocr Pract. 2006;12(1):63–102. - PubMed
-
- Thomas T, Nowka K, Lan L, Derwahl M. Expression of endoderm stem cell markers: evidence for the presence of adult stem cells in human thyroid. Thyroid. 2006;16:537–544. - PubMed
-
- Scholer HR, Ruppert S, Suzuki N. New type of POU domain in germ line-specific protein OCT-4. Nature. 1990;344:435–439. - PubMed
-
- Reya T, Morrison SJ, Clarke MF, Weissman IL. Stem cells, cancer, and cancer stem cells. Nature. 2001;414(6859):105–11. - PubMed
Publication types
MeSH terms
Substances
LinkOut - more resources
Full Text Sources
Other Literature Sources
Medical
Research Materials
Miscellaneous

