

Novel suppressors of alpha-synuclein toxicity identified using yeast
- PMID: 18772193
- PMCID: PMC2581432
- DOI: 10.1093/hmg/ddn276
Novel suppressors of alpha-synuclein toxicity identified using yeast
Abstract
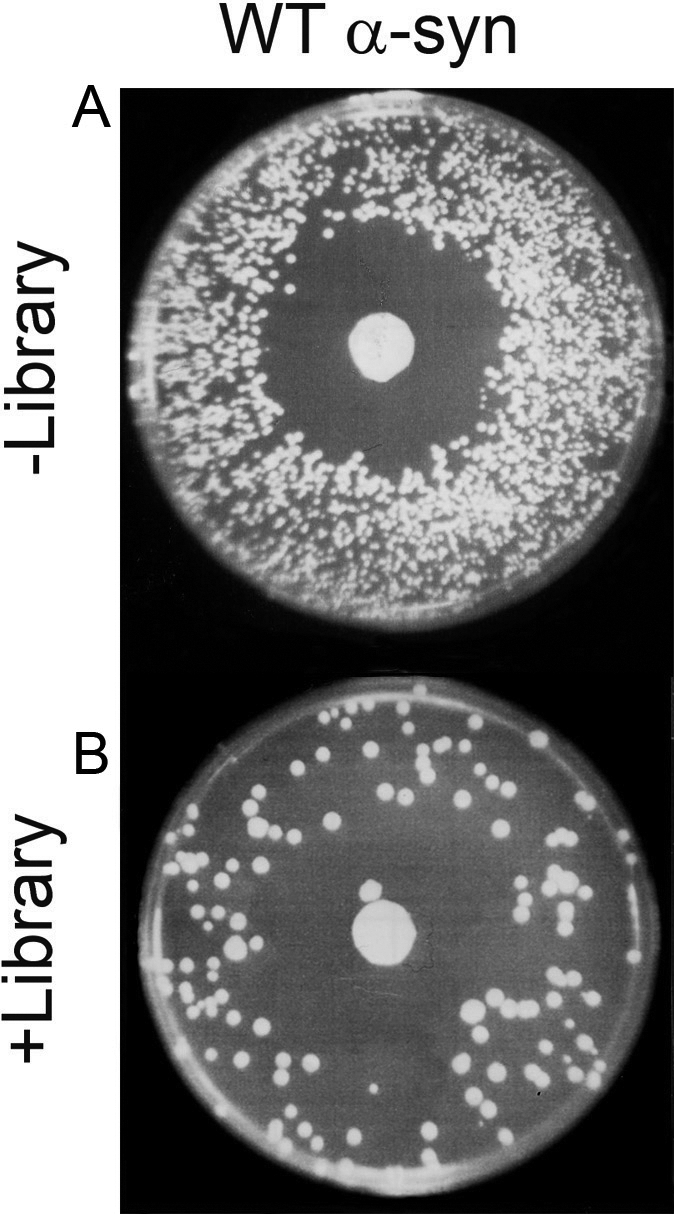
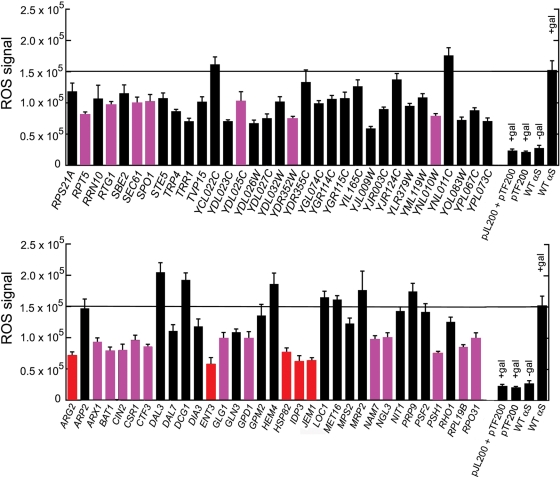
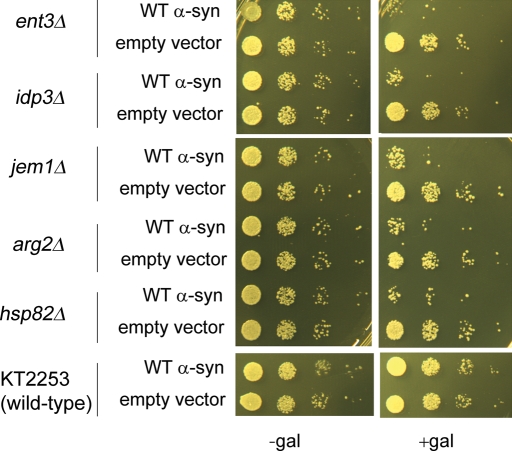
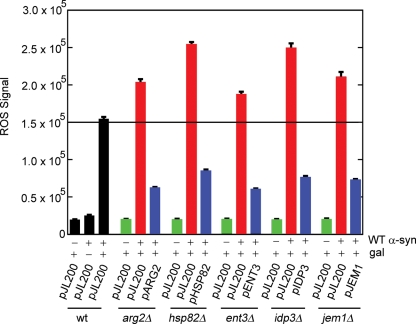
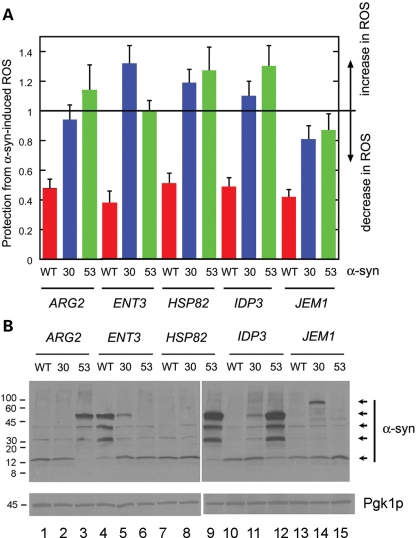
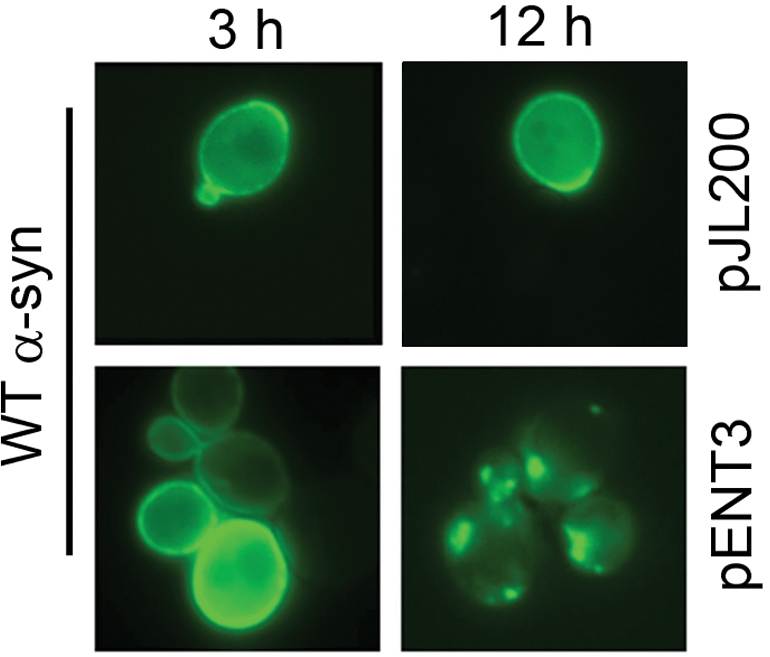
The mechanism by which the Parkinson's disease-related protein alpha-synuclein (alpha-syn) causes neurodegeneration has not been elucidated. To determine the genes that protect cells from alpha-syn, we used a genetic screen to identify suppressors of the super sensitivity of the yeast Saccharomyces cerevisiae expressing alpha-syn to killing by hydrogen peroxide. Forty genes in ubiquitin-dependent protein catabolism, protein biosynthesis, vesicle trafficking and the response to stress were identified. Five of the forty genes--ENT3, IDP3, JEM1, ARG2 and HSP82--ranked highest in their ability to block alpha-syn-induced reactive oxygen species accumulation, and these five genes were characterized in more detail. The deletion of any of these five genes enhanced the toxicity of alpha-syn as judged by growth defects compared with wild-type cells expressing alpha-syn, which indicates that these genes protect cells from alpha-syn. Strikingly, four of the five genes are specific for alpha-syn in that they fail to protect cells from the toxicity of the two inherited mutants A30P or A53T. This finding suggests that alpha-syn causes toxicity to cells through a different pathway than these two inherited mutants. Lastly, overexpression of Ent3p, which is a clathrin adapter protein involved in protein transport between the Golgi and the vacuole, causes alpha-syn to redistribute from the plasma membrane into cytoplasmic vesicular structures. Our interpretation is that Ent3p mediates the transport of alpha-syn to the vacuole for proteolytic degradation. A similar clathrin adaptor protein, epsinR, exists in humans.
Figures
Similar articles
-
Heat shock prevents alpha-synuclein-induced apoptosis in a yeast model of Parkinson's disease.J Mol Biol. 2005 Sep 2;351(5):1081-100. doi: 10.1016/j.jmb.2005.06.060. J Mol Biol. 2005. PMID: 16051265
-
Defects in very long chain fatty acid synthesis enhance alpha-synuclein toxicity in a yeast model of Parkinson's disease.PLoS One. 2011 Jan 11;6(1):e15946. doi: 10.1371/journal.pone.0015946. PLoS One. 2011. PMID: 21264320 Free PMC article.
-
YGR198w (YPP1) targets A30P alpha-synuclein to the vacuole for degradation.J Cell Biol. 2007 Jun 18;177(6):1091-104. doi: 10.1083/jcb.200610071. J Cell Biol. 2007. PMID: 17576801 Free PMC article.
-
alpha-Synuclein, oxidative stress and apoptosis from the perspective of a yeast model of Parkinson's disease.FEMS Yeast Res. 2006 Dec;6(8):1107-16. doi: 10.1111/j.1567-1364.2006.00135.x. FEMS Yeast Res. 2006. PMID: 17156009 Review.
-
Posttranslational Modifications and Clearing of α-Synuclein Aggregates in Yeast.Biomolecules. 2015 Apr 23;5(2):617-34. doi: 10.3390/biom5020617. Biomolecules. 2015. PMID: 25915624 Free PMC article. Review.
Cited by
-
Suppression of α-synuclein toxicity and vesicle trafficking defects by phosphorylation at S129 in yeast depends on genetic context.Hum Mol Genet. 2012 Jun 1;21(11):2432-49. doi: 10.1093/hmg/dds058. Epub 2012 Feb 21. Hum Mol Genet. 2012. PMID: 22357655 Free PMC article.
-
Ubiquitin-dependent proteolysis in yeast cells expressing neurotoxic proteins.Front Mol Neurosci. 2015 Mar 12;8:8. doi: 10.3389/fnmol.2015.00008. eCollection 2015. Front Mol Neurosci. 2015. PMID: 25814926 Free PMC article. Review.
-
From Yeast to Humans: Leveraging New Approaches in Yeast to Accelerate Discovery of Therapeutic Targets for Synucleinopathies.Methods Mol Biol. 2019;2049:419-444. doi: 10.1007/978-1-4939-9736-7_24. Methods Mol Biol. 2019. PMID: 31602625
-
Cellular models of alpha-synuclein toxicity and aggregation.J Neurochem. 2019 Sep;150(5):566-576. doi: 10.1111/jnc.14806. Epub 2019 Jul 30. J Neurochem. 2019. PMID: 31265132 Free PMC article. Review.
-
Hypokinesia and reduced dopamine levels in zebrafish lacking β- and γ1-synucleins.J Biol Chem. 2012 Jan 27;287(5):2971-83. doi: 10.1074/jbc.M111.308312. Epub 2011 Nov 29. J Biol Chem. 2012. PMID: 22128150 Free PMC article.
References
-
- Abou-Sleiman P.M., Healy D.G., Wood N.W. Causes of Parkinson’s disease: genetics of DJ-1. Cell Tissue Res. 2004;318:185–188. - PubMed
-
- Recchia A., Debetto P., Negro A., Guidolin D., Skaper S.D., Giusti P. Alpha-synuclein and Parkinson’s disease. FASEB J. 2004;18:617–626. - PubMed
-
- Moore D.J., West A.B., Dawson V.L., Dawson T.M. Molecular pathophysiology of Parkinson’s disease. Annu. Rev. Neurosci. 2005;28:57–87. - PubMed
-
- Dawson T.M., Dawson V.L. Molecular pathways of neurodegeneration in Parkinson’s disease. Science. 2003;302:819–822. - PubMed
Publication types
MeSH terms
Substances
Grants and funding
LinkOut - more resources
Full Text Sources
Medical
Molecular Biology Databases
Research Materials
Miscellaneous
