Identification and characterization of transmitted and early founder virus envelopes in primary HIV-1 infection
- PMID: 18490657
- PMCID: PMC2387184
- DOI: 10.1073/pnas.0802203105
Identification and characterization of transmitted and early founder virus envelopes in primary HIV-1 infection
Abstract
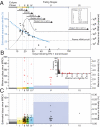
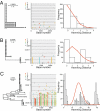
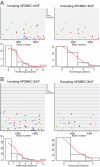
The precise identification of the HIV-1 envelope glycoprotein (Env) responsible for productive clinical infection could be instrumental in elucidating the molecular basis of HIV-1 transmission and in designing effective vaccines. Here, we developed a mathematical model of random viral evolution and, together with phylogenetic tree construction, used it to analyze 3,449 complete env sequences derived by single genome amplification from 102 subjects with acute HIV-1 (clade B) infection. Viral env genes evolving from individual transmitted or founder viruses generally exhibited a Poisson distribution of mutations and star-like phylogeny, which coalesced to an inferred consensus sequence at or near the estimated time of virus transmission. Overall, 78 of 102 subjects had evidence of productive clinical infection by a single virus, and 24 others had evidence of productive clinical infection by a minimum of two to five viruses. Phenotypic analysis of transmitted or early founder Envs revealed a consistent pattern of CCR5 dependence, masking of coreceptor binding regions, and equivalent or modestly enhanced resistance to the fusion inhibitor T1249 and broadly neutralizing antibodies compared with Envs from chronically infected subjects. Low multiplicity infection and limited viral evolution preceding peak viremia suggest a finite window of potential vulnerability of HIV-1 to vaccine-elicited immune responses, although phenotypic properties of transmitted Envs pose a formidable defense.
Conflict of interest statement
The authors declare no conflict of interest.
Figures


Similar articles
-
Origin and evolution of HIV-1 in breast milk determined by single-genome amplification and sequencing.J Virol. 2011 Mar;85(6):2751-63. doi: 10.1128/JVI.02316-10. Epub 2010 Dec 29. J Virol. 2011. PMID: 21191008 Free PMC article.
-
Rapid Induction of Multifunctional Antibodies in Rabbits and Macaques by Clade C HIV-1 CAP257 Envelopes Circulating During Epitope-Specific Neutralization Breadth Development.Front Immunol. 2020 Jun 2;11:984. doi: 10.3389/fimmu.2020.00984. eCollection 2020. Front Immunol. 2020. PMID: 32582155 Free PMC article.
-
Deciphering human immunodeficiency virus type 1 transmission and early envelope diversification by single-genome amplification and sequencing.J Virol. 2008 Apr;82(8):3952-70. doi: 10.1128/JVI.02660-07. Epub 2008 Feb 6. J Virol. 2008. PMID: 18256145 Free PMC article.
-
Centralized HIV-1 envelope immunogens and neutralizing antibodies.Curr HIV Res. 2007 Nov;5(6):572-7. doi: 10.2174/157016207782418498. Curr HIV Res. 2007. PMID: 18045113 Review.
-
HIV transmission.Cold Spring Harb Perspect Med. 2012 Nov 1;2(11):a006965. doi: 10.1101/cshperspect.a006965. Cold Spring Harb Perspect Med. 2012. PMID: 23043157 Free PMC article. Review.
Cited by
-
Sensitivity to monoclonal antibody 447-52D and an open env trimer conformation correlate poorly with inhibition of HIV-1 infectivity by SERINC5.Virology. 2020 Sep;548:73-81. doi: 10.1016/j.virol.2020.06.007. Epub 2020 Jun 17. Virology. 2020. PMID: 32838948 Free PMC article.
-
Host cell glycosylation selects for infection with CCR5- versus CXCR4-tropic HIV-1.Nat Microbiol. 2024 Nov;9(11):2985-2996. doi: 10.1038/s41564-024-01806-7. Epub 2024 Oct 3. Nat Microbiol. 2024. PMID: 39363105
-
Running loose or getting lost: how HIV-1 counters and capitalizes on APOBEC3-induced mutagenesis through its Vif protein.Viruses. 2012 Nov 14;4(11):3132-61. doi: 10.3390/v4113132. Viruses. 2012. PMID: 23202519 Free PMC article. Review.
-
Microbicides: topical prevention against HIV.Cold Spring Harb Perspect Med. 2012 Feb;2(2):a007385. doi: 10.1101/cshperspect.a007385. Cold Spring Harb Perspect Med. 2012. PMID: 22355798 Free PMC article. Review.
-
Human immunodeficiency virus vaccine trials.Cold Spring Harb Perspect Med. 2012 Dec 1;2(12):a007351. doi: 10.1101/cshperspect.a007351. Cold Spring Harb Perspect Med. 2012. PMID: 23209178 Free PMC article. Review.
References
-
- Shattock RJ, Moore JP. Inhibiting sexual transmission of HIV-1 infection. Nat Rev Microbiol. 2003;1:25–34. - PubMed
-
- Wolfs TF, Zwart G, Bakker M, Goudsmit J. HIV-1 genomic RNA diversification following sexual and parenteral virus transmission. Virology. 1992;189:103–110. - PubMed
-
- Wolinsky SM, et al. Selective transmission of human immunodeficiency virus type-1 variants from mothers to infants. Science. 1992;255:1134–1137. - PubMed
-
- Zhu T, et al. Genotypic and phenotypic characterization of HIV-1 patients with primary infection. Science. 1993;261:1179–1181. - PubMed
Publication types
MeSH terms
Substances
Associated data
- Actions
- Actions
- Actions
- Actions
- Actions
- Actions
- Actions
- Actions
- Actions
- Actions
- Actions
- Actions
- Actions
- Actions
- Actions
- Actions
- Actions
- Actions
- Actions
- Actions
- Actions
- Actions
- Actions
- Actions
- Actions
- Actions
- Actions
- Actions
- Actions
- Actions
- Actions
- Actions
- Actions
- Actions
- Actions
- Actions
- Actions
- Actions
- Actions
- Actions
- Actions
- Actions
- Actions
- Actions
- Actions
- Actions
- Actions
- Actions
- Actions
- Actions
- Actions
- Actions
- Actions
- Actions
- Actions
- Actions
- Actions
- Actions
- Actions
- Actions
- Actions
- Actions
- Actions
- Actions
- Actions
- Actions
- Actions
- Actions
- Actions
- Actions
- Actions
- Actions
- Actions
- Actions
- Actions
- Actions
- Actions
- Actions
- Actions
- Actions
- Actions
- Actions
- Actions
- Actions
- Actions
- Actions
- Actions
- Actions
- Actions
- Actions
- Actions
- Actions
- Actions
- Actions
- Actions
- Actions
- Actions
- Actions
- Actions
- Actions
- Actions
- Actions
- Actions
- Actions
- Actions
- Actions
- Actions
- Actions
- Actions
- Actions
- Actions
- Actions
- Actions
- Actions
- Actions
- Actions
- Actions
- Actions
- Actions
- Actions
- Actions
- Actions
- Actions
- Actions
- Actions
- Actions
- Actions
- Actions
- Actions
- Actions
- Actions
- Actions
- Actions
- Actions
- Actions
- Actions
- Actions
- Actions
- Actions
- Actions
- Actions
- Actions
- Actions
- Actions
- Actions
- Actions
- Actions
- Actions
- Actions
- Actions
- Actions
- Actions
- Actions
- Actions
- Actions
- Actions
- Actions
- Actions
- Actions
- Actions
- Actions
- Actions
- Actions
- Actions
- Actions
- Actions
- Actions
- Actions
- Actions
- Actions
- Actions
- Actions
- Actions
- Actions
- Actions
- Actions
- Actions
- Actions
- Actions
- Actions
- Actions
- Actions
- Actions
- Actions
- Actions
- Actions
- Actions
- Actions
- Actions
- Actions
- Actions
- Actions
- Actions
- Actions
- Actions
- Actions
- Actions
- Actions
- Actions
- Actions
- Actions
- Actions
- Actions
- Actions
- Actions
- Actions
- Actions
- Actions
- Actions
- Actions
- Actions
- Actions
- Actions
- Actions
- Actions
- Actions
- Actions
- Actions
- Actions
- Actions
- Actions
- Actions
- Actions
- Actions
- Actions
- Actions
- Actions
- Actions
- Actions
- Actions
- Actions
- Actions
- Actions
- Actions
- Actions
- Actions
- Actions
- Actions
- Actions
- Actions
- Actions
- Actions
- Actions
- Actions
- Actions
- Actions
- Actions
- Actions
- Actions
- Actions
- Actions
- Actions
- Actions
- Actions
- Actions
- Actions
- Actions
- Actions
- Actions
- Actions
- Actions
- Actions
- Actions
- Actions
- Actions
- Actions
- Actions
- Actions
- Actions
- Actions
- Actions
- Actions
- Actions
- Actions
- Actions
- Actions
- Actions
- Actions
- Actions
- Actions
- Actions
- Actions
- Actions
- Actions
- Actions
- Actions
- Actions
- Actions
- Actions
- Actions
- Actions
- Actions
- Actions
- Actions
- Actions
- Actions
- Actions
- Actions
- Actions
- Actions
- Actions
- Actions
- Actions
- Actions
- Actions
- Actions
- Actions
- Actions
- Actions
- Actions
- Actions
- Actions
- Actions
- Actions
- Actions
- Actions
- Actions
- Actions
- Actions
- Actions
- Actions
- Actions
- Actions
- Actions
- Actions
- Actions
- Actions
- Actions
- Actions
- Actions
- Actions
- Actions
- Actions
- Actions
- Actions
- Actions
- Actions
- Actions
- Actions
- Actions
- Actions
- Actions
- Actions
- Actions
- Actions
- Actions
- Actions
- Actions
- Actions
- Actions
- Actions
- Actions
- Actions
- Actions
- Actions
- Actions
- Actions
- Actions
- Actions
- Actions
- Actions
- Actions
- Actions
- Actions
- Actions
- Actions
- Actions
- Actions
- Actions
- Actions
- Actions
- Actions
- Actions
- Actions
- Actions
- Actions
- Actions
- Actions
- Actions
- Actions
- Actions
- Actions
- Actions
- Actions
- Actions
- Actions
- Actions
- Actions
- Actions
- Actions
- Actions
- Actions
- Actions
- Actions
- Actions
- Actions
- Actions
- Actions
- Actions
- Actions
- Actions
- Actions
- Actions
- Actions
- Actions
- Actions
- Actions
- Actions
- Actions
- Actions
- Actions
- Actions
- Actions
- Actions
- Actions
- Actions
- Actions
- Actions
- Actions
- Actions
- Actions
- Actions
- Actions
- Actions
- Actions
- Actions
- Actions
- Actions
- Actions
- Actions
- Actions
- Actions
- Actions
- Actions
- Actions
- Actions
- Actions
- Actions
- Actions
- Actions
- Actions
- Actions
- Actions
- Actions
- Actions
- Actions
- Actions
- Actions
- Actions
- Actions
- Actions
- Actions
- Actions
- Actions
- Actions
- Actions
- Actions
- Actions
- Actions
- Actions
- Actions
- Actions
- Actions
- Actions
- Actions
- Actions
- Actions
- Actions
- Actions
- Actions
- Actions
- Actions
- Actions
- Actions
- Actions
- Actions
- Actions
- Actions
- Actions
- Actions
- Actions
- Actions
- Actions
- Actions
- Actions
- Actions
- Actions
- Actions
- Actions
- Actions
- Actions
- Actions
- Actions
- Actions
- Actions
- Actions
- Actions
- Actions
- Actions
- Actions
- Actions
- Actions
- Actions
- Actions
- Actions
- Actions
- Actions
- Actions
- Actions
- Actions
- Actions
- Actions
- Actions
- Actions
- Actions
- Actions
- Actions
- Actions
- Actions
- Actions
- Actions
- Actions
- Actions
- Actions
- Actions
- Actions
- Actions
- Actions
- Actions
- Actions
- Actions
- Actions
- Actions
- Actions
- Actions
- Actions
- Actions
- Actions
- Actions
- Actions
- Actions
- Actions
- Actions
- Actions
- Actions
- Actions
- Actions
- Actions
- Actions
- Actions
- Actions
- Actions
- Actions
- Actions
- Actions
- Actions
- Actions
- Actions
- Actions
- Actions
- Actions
- Actions
- Actions
- Actions
- Actions
- Actions
- Actions
- Actions
- Actions
- Actions
- Actions
- Actions
- Actions
- Actions
- Actions
- Actions
- Actions
- Actions
- Actions
- Actions
- Actions
- Actions
- Actions
- Actions
- Actions
- Actions
- Actions
- Actions
- Actions
- Actions
- Actions
- Actions
- Actions
- Actions
- Actions
- Actions
- Actions
- Actions
- Actions
- Actions
- Actions
- Actions
- Actions
- Actions
- Actions
- Actions
- Actions
- Actions
- Actions
- Actions
- Actions
- Actions
- Actions
- Actions
- Actions
- Actions
- Actions
- Actions
- Actions
- Actions
- Actions
- Actions
- Actions
- Actions
- Actions
- Actions
- Actions
- Actions
- Actions
- Actions
- Actions
- Actions
- Actions
- Actions
- Actions
- Actions
- Actions
- Actions
- Actions
- Actions
- Actions
- Actions
- Actions
- Actions
- Actions
- Actions
- Actions
- Actions
- Actions
- Actions
- Actions
- Actions
- Actions
- Actions
- Actions
- Actions
- Actions
- Actions
- Actions
- Actions
- Actions
- Actions
- Actions
- Actions
- Actions
- Actions
- Actions
- Actions
- Actions
- Actions
- Actions
- Actions
- Actions
- Actions
- Actions
- Actions
- Actions
- Actions
- Actions
- Actions
- Actions
- Actions
- Actions
- Actions
- Actions
- Actions
- Actions
- Actions
- Actions
- Actions
- Actions
- Actions
- Actions
- Actions
- Actions
- Actions
- Actions
- Actions
- Actions
- Actions
- Actions
- Actions
- Actions
- Actions
- Actions
- Actions
- Actions
- Actions
- Actions
- Actions
- Actions
- Actions
- Actions
- Actions
- Actions
- Actions
- Actions
- Actions
- Actions
- Actions
- Actions
- Actions
- Actions
- Actions
- Actions
- Actions
- Actions
- Actions
- Actions
- Actions
- Actions
- Actions
- Actions
- Actions
- Actions
- Actions
- Actions
- Actions
- Actions
- Actions
- Actions
- Actions
- Actions
- Actions
- Actions
- Actions
- Actions
- Actions
- Actions
- Actions
- Actions
- Actions
- Actions
- Actions
- Actions
- Actions
- Actions
- Actions
- Actions
- Actions
- Actions
- Actions
- Actions
- Actions
- Actions
- Actions
- Actions
- Actions
- Actions
- Actions
- Actions
- Actions
- Actions
- Actions
- Actions
- Actions
- Actions
- Actions
- Actions
- Actions
- Actions
- Actions
- Actions
- Actions
- Actions
- Actions
- Actions
- Actions
- Actions
- Actions
- Actions
- Actions
- Actions
- Actions
- Actions
- Actions
- Actions
- Actions
- Actions
- Actions
- Actions
- Actions
- Actions
- Actions
- Actions
- Actions
- Actions
- Actions
- Actions
- Actions
- Actions
- Actions
- Actions
- Actions
- Actions
- Actions
- Actions
- Actions
- Actions
- Actions
- Actions
- Actions
- Actions
- Actions
- Actions
- Actions
- Actions
- Actions
- Actions
- Actions
- Actions
- Actions
- Actions
- Actions
- Actions
- Actions
- Actions
- Actions
- Actions
- Actions
- Actions
- Actions
- Actions
- Actions
- Actions
- Actions
- Actions
- Actions
- Actions
- Actions
- Actions
- Actions
- Actions
- Actions
- Actions
- Actions
- Actions
- Actions
- Actions
- Actions
- Actions
- Actions
- Actions
- Actions
- Actions
- Actions
- Actions
- Actions
- Actions
- Actions
- Actions
- Actions
- Actions
- Actions
- Actions
- Actions
- Actions
- Actions
- Actions
- Actions
- Actions
- Actions
- Actions
- Actions
- Actions
- Actions
- Actions
- Actions
- Actions
- Actions
- Actions
- Actions
- Actions
- Actions
- Actions
- Actions
- Actions
- Actions
- Actions
- Actions
- Actions
- Actions
- Actions
- Actions
- Actions
- Actions
- Actions
- Actions
- Actions
- Actions
- Actions
- Actions
- Actions
- Actions
- Actions
- Actions
- Actions
- Actions
- Actions
- Actions
- Actions
- Actions
- Actions
- Actions
- Actions
- Actions
- Actions
- Actions
- Actions
- Actions
- Actions
- Actions
- Actions
- Actions
- Actions
- Actions
- Actions
- Actions
- Actions
- Actions
- Actions
- Actions
- Actions
- Actions
- Actions
- Actions
- Actions
- Actions
- Actions
- Actions
- Actions
- Actions
- Actions
- Actions
- Actions
- Actions
- Actions
- Actions
- Actions
- Actions
- Actions
- Actions
- Actions
- Actions
- Actions
- Actions
- Actions
- Actions
- Actions
- Actions
- Actions
- Actions
- Actions
- Actions
- Actions
- Actions
- Actions
- Actions
- Actions
- Actions
- Actions
- Actions
- Actions
- Actions
- Actions
- Actions
- Actions
- Actions
- Actions
- Actions
- Actions
- Actions
- Actions
- Actions
- Actions
- Actions
- Actions
- Actions
- Actions
- Actions
Grants and funding
- U01 AI067854/AI/NIAID NIH HHS/United States
- AI41530/AI/NIAID NIH HHS/United States
- AI67854/AI/NIAID NIH HHS/United States
- U01 AI041530/AI/NIAID NIH HHS/United States
- AI64518/AI/NIAID NIH HHS/United States
- U19 AI067854/AI/NIAID NIH HHS/United States
- P30 AI064518/AI/NIAID NIH HHS/United States
- AI27767/AI/NIAID NIH HHS/United States
- AI50410/AI/NIAID NIH HHS/United States
- P30 AI050410/AI/NIAID NIH HHS/United States
- P30 AI027767/AI/NIAID NIH HHS/United States
- T32 AI007392/AI/NIAID NIH HHS/United States
- AI61734/AI/NIAID NIH HHS/United States
- P01 AI061734/AI/NIAID NIH HHS/United States
LinkOut - more resources
Full Text Sources
Other Literature Sources
Medical
Molecular Biology Databases

