Simian immunodeficiency virus-induced mucosal interleukin-17 deficiency promotes Salmonella dissemination from the gut
- PMID: 18376406
- PMCID: PMC2901863
- DOI: 10.1038/nm1743
Simian immunodeficiency virus-induced mucosal interleukin-17 deficiency promotes Salmonella dissemination from the gut
Abstract
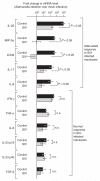
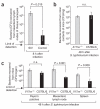
Salmonella typhimurium causes a localized enteric infection in immunocompetent individuals, whereas HIV-infected individuals develop a life-threatening bacteremia. Here we show that simian immunodeficiency virus (SIV) infection results in depletion of T helper type 17 (TH17) cells in the ileal mucosa of rhesus macaques, thereby impairing mucosal barrier functions to S. typhimurium dissemination. In SIV-negative macaques, the gene expression profile induced by S. typhimurium in ligated ileal loops was dominated by TH17 responses, including the expression of interleukin-17 (IL-17) and IL-22. TH17 cells were markedly depleted in SIV-infected rhesus macaques, resulting in blunted TH17 responses to S. typhimurium infection and increased bacterial dissemination. IL-17 receptor-deficient mice showed increased systemic dissemination of S. typhimurium from the gut, suggesting that IL-17 deficiency causes defects in mucosal barrier function. We conclude that SIV infection impairs the IL-17 axis, an arm of the mucosal immune response preventing systemic microbial dissemination from the gastrointestinal tract.
Figures


Similar articles
-
Th17 cells, HIV and the gut mucosal barrier.Curr Opin HIV AIDS. 2010 Mar;5(2):173-8. doi: 10.1097/COH.0b013e328335eda3. Curr Opin HIV AIDS. 2010. PMID: 20543596 Review.
-
Th17 cells in pathogenic simian immunodeficiency virus infection of macaques.Curr Opin HIV AIDS. 2010 Mar;5(2):141-5. doi: 10.1097/COH.0b013e32833653ec. Curr Opin HIV AIDS. 2010. PMID: 20543591 Free PMC article. Review.
-
Loss of IL-17-producing CD8 T cells during late chronic stage of pathogenic simian immunodeficiency virus infection.J Immunol. 2011 Jan 15;186(2):745-53. doi: 10.4049/jimmunol.1002807. Epub 2010 Dec 10. J Immunol. 2011. PMID: 21148794
-
Enteric pathology and Salmonella-induced cell death in healthy and SIV-infected rhesus macaques.Vet Pathol. 2011 Sep;48(5):933-41. doi: 10.1177/0300985810386468. Epub 2010 Nov 1. Vet Pathol. 2011. PMID: 21041540
-
Dysregulation of IL-17/IL-22 Effector Functions in Blood and Gut Mucosal Gamma Delta T Cells Correlates With Increase in Circulating Leaky Gut and Inflammatory Markers During cART-Treated Chronic SIV Infection in Macaques.Front Immunol. 2021 Feb 25;12:647398. doi: 10.3389/fimmu.2021.647398. eCollection 2021. Front Immunol. 2021. PMID: 33717202 Free PMC article.
Cited by
-
Fast disease progression in simian HIV-infected female macaque is accompanied by a robust local inflammatory innate immune and microbial response.AIDS. 2015 Jun 19;29(10):F1-8. doi: 10.1097/QAD.0000000000000711. AIDS. 2015. PMID: 26035329 Free PMC article.
-
Innate immune signaling in defense against intestinal microbes.Immunol Rev. 2012 Jan;245(1):113-31. doi: 10.1111/j.1600-065X.2011.01081.x. Immunol Rev. 2012. PMID: 22168416 Free PMC article. Review.
-
Role of CD8 T Cell Replicative Senescence in Human Aging and in HIV-mediated Immunosenescence.Aging Dis. 2011 Oct;2(5):382-397. Aging Dis. 2011. PMID: 22308228 Free PMC article.
-
Gene expression of Lactobacillus plantarum and the commensal microbiota in the ileum of healthy and early SIV-infected rhesus macaques.Sci Rep. 2016 Apr 22;6:24723. doi: 10.1038/srep24723. Sci Rep. 2016. PMID: 27102350 Free PMC article.
-
Intestinal intraepithelial lymphocytes: Maintainers of intestinal immune tolerance and regulators of intestinal immunity.J Leukoc Biol. 2021 Feb;109(2):339-347. doi: 10.1002/JLB.3RU0220-111. Epub 2020 Jul 17. J Leukoc Biol. 2021. PMID: 32678936 Free PMC article. Review.
References
-
- Hohmann EL. Nontyphoidal salmonellosis. Clin. Infect. Dis. 2001;32:263–269. - PubMed
-
- Gordon MA, et al. Bacteraemia and mortality among adult medical admissions in Malawi-predominance of non-typhi salmonellae and Streptococcus pneumoniae. J. Infect. 2001;42:44–49. - PubMed
-
- Alausa KO, et al. Septicaemia in the tropics. A prospective epidemiological study of 146 patients with a high case fatality rate. Scand. J. Infect. Dis. 1977;9:181–185. - PubMed
-
- Kankwatira AM, Mwafulirwa GA, Gordon MA. Non-typhoidal salmonella bacteraemia—an under-recognized feature of AIDS in African adults. Trop. Doct. 2004;34:198–200. - PubMed
Publication types
MeSH terms
Substances
Grants and funding
- R01 HL061271-08/HL/NHLBI NIH HHS/United States
- R01 HL079142-04/HL/NHLBI NIH HHS/United States
- R01 AI044170/AI/NIAID NIH HHS/United States
- R01 DK043183/DK/NIDDK NIH HHS/United States
- R01 AI040124/AI/NIAID NIH HHS/United States
- DK43183/DK/NIDDK NIH HHS/United States
- R01 AI043274/AI/NIAID NIH HHS/United States
- AI044170/AI/NIAID NIH HHS/United States
- R01 HL079142/HL/NHLBI NIH HHS/United States
- DK61297/DK/NIDDK NIH HHS/United States
- AI06055/AI/NIAID NIH HHS/United States
- AI43274/AI/NIAID NIH HHS/United States
- R21 AI065534/AI/NIAID NIH HHS/United States
- AI040124/AI/NIAID NIH HHS/United States
- R37 HL079142/HL/NHLBI NIH HHS/United States
- AI065534/AI/NIAID NIH HHS/United States
- R29 AI040124/AI/NIAID NIH HHS/United States
- R01 HL061271/HL/NHLBI NIH HHS/United States
- R01 DK061297/DK/NIDDK NIH HHS/United States
LinkOut - more resources
Full Text Sources
Other Literature Sources
Molecular Biology Databases

