Evaluation of MHC class I peptide binding prediction servers: applications for vaccine research
- PMID: 18366636
- PMCID: PMC2323361
- DOI: 10.1186/1471-2172-9-8
Evaluation of MHC class I peptide binding prediction servers: applications for vaccine research
Abstract
Background: Protein antigens and their specific epitopes are formulation targets for epitope-based vaccines. A number of prediction servers are available for identification of peptides that bind major histocompatibility complex class I (MHC-I) molecules. The lack of standardized methodology and large number of human MHC-I molecules make the selection of appropriate prediction servers difficult. This study reports a comparative evaluation of thirty prediction servers for seven human MHC-I molecules.
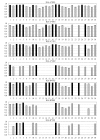
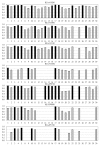
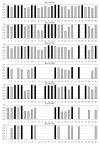
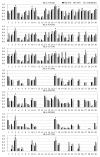
Results: Of 147 individual predictors 39 have shown excellent, 47 good, 33 marginal, and 28 poor ability to classify binders from non-binders. The classifiers for HLA-A*0201, A*0301, A*1101, B*0702, B*0801, and B*1501 have excellent, and for A*2402 moderate classification accuracy. Sixteen prediction servers predict peptide binding affinity to MHC-I molecules with high accuracy; correlation coefficients ranging from r = 0.55 (B*0801) to r = 0.87 (A*0201).
Conclusion: Non-linear predictors outperform matrix-based predictors. Most predictors can be improved by non-linear transformations of their raw prediction scores. The best predictors of peptide binding are also best in prediction of T-cell epitopes. We propose a new standard for MHC-I binding prediction - a common scale for normalization of prediction scores, applicable to both experimental and predicted data. The results of this study provide assistance to researchers in selection of most adequate prediction tools and selection criteria that suit the needs of their projects.
Figures

Similar articles
-
Systematically benchmarking peptide-MHC binding predictors: From synthetic to naturally processed epitopes.PLoS Comput Biol. 2018 Nov 8;14(11):e1006457. doi: 10.1371/journal.pcbi.1006457. eCollection 2018 Nov. PLoS Comput Biol. 2018. PMID: 30408041 Free PMC article.
-
Prediction of MHC class I binding peptides, using SVMHC.BMC Bioinformatics. 2002 Sep 11;3:25. doi: 10.1186/1471-2105-3-25. BMC Bioinformatics. 2002. PMID: 12225620 Free PMC article.
-
A combined prediction strategy increases identification of peptides bound with high affinity and stability to porcine MHC class I molecules SLA-1*04:01, SLA-2*04:01, and SLA-3*04:01.Immunogenetics. 2016 Feb;68(2):157-65. doi: 10.1007/s00251-015-0883-9. Epub 2015 Nov 14. Immunogenetics. 2016. PMID: 26572135
-
A comprehensive review and performance evaluation of bioinformatics tools for HLA class I peptide-binding prediction.Brief Bioinform. 2020 Jul 15;21(4):1119-1135. doi: 10.1093/bib/bbz051. Brief Bioinform. 2020. PMID: 31204427 Free PMC article. Review.
-
Major histocompatibility complex class I binding predictions as a tool in epitope discovery.Immunology. 2010 Jul;130(3):309-18. doi: 10.1111/j.1365-2567.2010.03300.x. Epub 2010 May 26. Immunology. 2010. PMID: 20518827 Free PMC article. Review.
Cited by
-
The utility and limitations of current Web-available algorithms to predict peptides recognized by CD4 T cells in response to pathogen infection.J Immunol. 2012 May 1;188(9):4235-48. doi: 10.4049/jimmunol.1103640. Epub 2012 Mar 30. J Immunol. 2012. PMID: 22467652 Free PMC article.
-
Conservation analysis of dengue virus T-cell epitope-based vaccine candidates using Peptide block entropy.Front Immunol. 2011 Dec 20;2:69. doi: 10.3389/fimmu.2011.00069. eCollection 2011. Front Immunol. 2011. PMID: 22566858 Free PMC article.
-
Identification of CD8+ T cell epitopes in the West Nile virus polyprotein by reverse-immunology using NetCTL.PLoS One. 2010 Sep 14;5(9):e12697. doi: 10.1371/journal.pone.0012697. PLoS One. 2010. PMID: 20856867 Free PMC article.
-
A conserved E7-derived cytotoxic T lymphocyte epitope expressed on human papillomavirus 16-transformed HLA-A2+ epithelial cancers.J Biol Chem. 2010 Sep 17;285(38):29608-22. doi: 10.1074/jbc.M110.126722. Epub 2010 Jul 8. J Biol Chem. 2010. PMID: 20615877 Free PMC article.
-
Advances in the design and delivery of peptide subunit vaccines with a focus on toll-like receptor agonists.Expert Rev Vaccines. 2010 Feb;9(2):157-73. doi: 10.1586/erv.09.160. Expert Rev Vaccines. 2010. PMID: 20109027 Free PMC article. Review.
References
-
- Riedl P, Reimann J, Schirmbeck R. Complexes of DNA vaccines with cationic, antigenic peptides are potent, polyvalent CD8(+) T-cell-stimulating immunogens. Methods in molecular medicine. 2006;127:159–169. - PubMed
Publication types
MeSH terms
Substances
Grants and funding
LinkOut - more resources
Full Text Sources
Other Literature Sources
Medical
Research Materials

