. 2008 Feb 18;205(2):451-64.
doi: 10.1084/jem.20071108. Epub 2008 Feb 11.

Homeostatic MyD88-dependent signals cause lethal inflamMation in the absence of A20

Affiliations

Homeostatic MyD88-dependent signals cause lethal inflamMation in the absence of A20

Emre E Turer et al. J Exp Med. .

Abstract

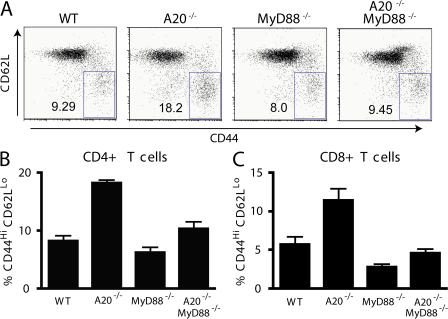
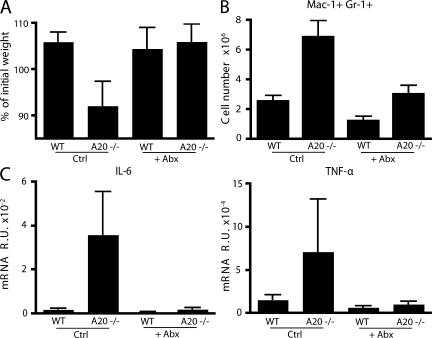
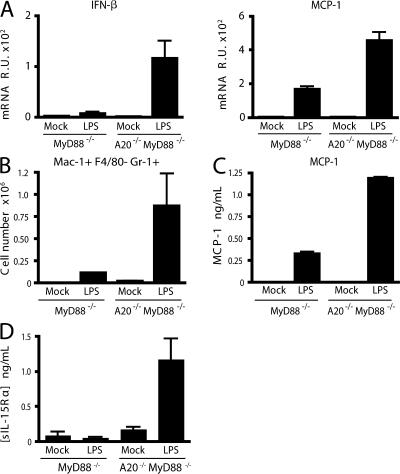
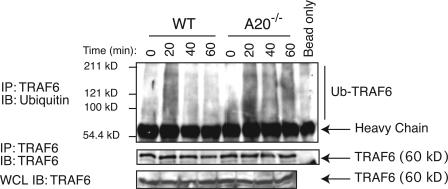
Toll-like receptors (TLRs) on host cells are chronically engaged by microbial ligands during homeostatic conditions. These signals do not cause inflammatory immune responses in unperturbed mice, even though they drive innate and adaptive immune responses when combating microbial infections. A20 is a ubiquitin-modifying enzyme that restricts exogenous TLR-induced signals. We show that MyD88-dependent TLR signals drive the spontaneous T cell and myeloid cell activation, cachexia, and premature lethality seen in A20-deficient mice. We have used broad spectrum antibiotics to demonstrate that these constitutive TLR signals are driven by commensal intestinal flora. A20 restricts TLR signals by restricting ubiquitylation of the E3 ligase tumor necrosis factor receptor-associated factor 6. These results reveal both the severe proinflammatory pathophysiology that can arise from homeostatic TLR signals as well as the critical role of A20 in restricting these signals in vivo. In addition, A20 restricts MyD88-independent TLR signals by inhibiting Toll/interleukin 1 receptor domain-containing adaptor inducing interferon (IFN) beta-dependent nuclear factor kappaB signals but not IFN response factor 3 signaling. These findings provide novel insights into how physiological TLR signals are regulated.


Figures

Figure 1.
Figure 1.
MyD88-dependent cachexia and lethality in A20−/− mice. (A) Survival of mice from the indicated genotypes at 8 wk of age (WT, A20+/− MyD88+/−; A20−/−, A20−/− MyD88+/−; MyD88−/−, A20+/− MyD88−/−; and A20−/− MyD88−/−). The percentage of mice in each cohort that dies before 8 wk of age is indicated by the column heights. Total numbers of mice in each cohort are indicated above each column. (B) Representative 3-mo-old mice from the indicated genotypes. Note the cachexia of the A20−/− but not the A20−/− MyD88−/− mouse. (C) Weight of surviving mice. Graph represents mean body weights of 10–14-wk-old mice from the indicated genotypes. Error bars represent standard deviations. Data are representative of at least five mice from each genotype.
Figure 2.
Figure 2.
Reduced myeloid accumulation and splenomegaly in A20−/− MyD88−/− mice. (A) Spleen weights from 6–8-wk-old mice of the indicated genotypes. (B) Total numbers of Mac1+ Gr1+ myeloid cells (activated macrophages and granulocytes) from spleens of mice of the indicated genotypes. (C) Representative flow cytometric analysis of Mac-1+ Gr-1+ myeloid cells from peripheral and mesenteric lymph nodes and spleens from mice of the indicated genotypes. Note the decreased frequency and numbers of myeloid cells in lymphoid organs from A20−/− MyD88−/− mice compared with A20−/− mice. Numbers indicate the percentage of live Mac-1+ Gr-1+ splenocytes within the indicated gates. (D) ELISA analyses of IL-6 levels in serum from mice of the indicated genotypes. Error bars represent standard deviations. Data are representative of at least five mice from each genotype.
Figure 3.
Figure 3.
MyD88 dependence of T cell hyperactivation in A20−/− mice. (A) Flow cytometric analyses of T cell phenotypes from peripheral lymph nodes from 5–6-wk-old mice of the indicated genotypes. Representative FACS plots of CD4+ T cells. The numbers represent the percentages of CD4+ T cells that are CD44Hi and CD62LLo (boxed gates), indicating an effector/memory T cell phenotype. Note the increased frequency of activated CD4+ T cells in A20−/− animals, and the reduced percentages of activated T cells in A20−/− MyD88−/− mice. (B) Quantitation of activated CD4+ (CD44Hi CD62LLo) T cells. (C) Quantitation of activated CD8+ T cells. Error bars represent standard deviations. Data are representative of at least three mice per genotype.
Figure 4.
Figure 4.
A20 expression in hematopoietic cells restricts MyD88-driven spontaneous inflammation in radiation chimera. (A) Flow cytometric analyses of chimeric mice generated by transfer of A20+/− MyD88+/−, A20−/− MyD88+/+, A20+/+ MyD88−/−, or A20−/− MyD8−/− bone marrow HSCs into lethally irradiated C57BL/6J mice. 6 wk after reconstitution, spleens from chimeric mice were analyzed by flow cytometry for the number of the indicated myeloid cell types (Mac1+ Gr1+, activated macrophages and neutrophils; Mac1+ F4/80 Gr1+, neutrophils; Mac1+ F4/80+ Siglec F, macrophages; and F4/80+ Siglec F+ SSCHi, eosinophils). The numbers of Mac-1+ , Mac-1+ Gr-1+, and Mac-1+ F4/80 Gr-1+ cells were statistically different (P < 0.05) between A20−/− and A20−/− MyD88−/− mice. (B) Quantitative real-time PCR analyses of mRNA levels of the indicated cytokines in spleens from chimeric mice. Splenic expression levels of the indicated cytokines are shown in R.U. for the chimeric mice described in A. All cytokine mRNA levels were normalized to β-actin mRNA. The levels of cytokines were statistically different between A20−/− and A20−/− MyD88−/− mice for all cytokines. Error bars indicate standard deviations. Graphs display results from at least three independent mice per genotype.
Figure 5.
Figure 5.
Depletion of commensals with broad-spectrum antibiotics diminishes inflammation driven by A20−/− hematopoietic cells. Chimeric mice were generated from transfer of A20+/+ (WT) or A20−/− Ly5.1+ bone marrow HSCs into sublethally irradiated congenic Ly5.2+ C57BL/6J mice. 2 wk after irradiation, animals were given 0.5 gram per liter of vancomycin, 1 gram per liter of ampicillin, 1 gram per liter of neomycin, 1 gram per liter of metronidazole, and trimethoprim-sulfamethoxazole in drinking water for 3–4 wk (+Abx) or maintained on trimethoprim-sulfamethoxazole (Ctrl) for the same period. (A) The percent weight change of chimeric mice reconstituted with HSCs of the indicated genotypes and treated with either broad spectrum (+Abx) or control antibiotics (Ctrl). The percent change was calculated by dividing the weight of each mouse on the day of death/analysis by the weight on the day of irradiation and HSC reconstitution. (B) Flow cytometric analyses of Ly5.1+ Mac1+ Gr1+ cells from spleens of chimeric mice. (C) Quantitative real-time PCR analysis of mRNA levels of IL-6 and TNF in spleens of chimeric mice. Note that A20−/− HSC-reconstituted chimera spontaneously lose weight, accumulate myeloid cells, and express higher levels of splenic IL-6 and TNF than A20+/+ HSC-reconstituted chimera, whereas treatment of A20−/− HSC-reconstituted chimera with broad spectrum antibiotics prevents these signs of inflammation. Error bars represent standard deviations. Data are representative of five mice.
Figure 6.
Figure 6.
A20 expression in hematopoietic cells restricts TRIF-dependent LPS responses in vivo. Chimeric mice were generated using HSCs of the indicated genotypes and lethally irradiated C57BL/6J mice. 6 wk after reconstitution, chimeric mice were injected with 100 μg LPS or PBS (mock) intraperitoneally and killed after 2 h. (A) Real-time PCR analyses of IFN-β and MCP-1 mRNA levels in splenocytes from the indicated mice. mRNA levels were normalized to GAPDH mRNA and expressed as R.U. (B) Flow cytometric analyses of the number of Mac1+ Gr1+ F4/80 neutrophils recruited to the peritoneal cavities of the indicated mice. Absolute numbers of neutrophils obtained in 5 ml of peritoneal lavage are shown. (C) ELISA determination of levels of MCP-1 protein obtained in peritoneal lavages of mice of the indicated genotypes. (D) ELISA determination of soluble IL-15Rα levels measured in the serum of the indicated mice. Error bars represent standard deviations. Data are representative of three mice in each treatment group.
Figure 7.
Figure 7.
A20 is critical for directly restricting MyD88-independent LPS responses. (A) ELISA analysis of IFN-β secretion by LPS-stimulated BMDMs. TNF−/− MyD88−/− and A20−/− TNF−/− MyD88−/− BMDMs were stimulated for 24 h with LPS, after which supernatants were harvested for ELISA. (B) Immunoblotting analyses of phospho-IκBα and IκBα protein expression by LSP-stimulated BMDMs. TNF−/− MyD88−/− and A20−/− TNF−/− MyD88−/− BMDMs were stimulated with LPS for the indicated times, after which cells were lysed for immunoblotting analyses for the indicated proteins. Actin protein levels are shown as a loading control. (C) Immunoblotting analyses of nuclear lysates for phospho-IRF3 protein expression by LPS-stimulated BMDMs. Nuclear USF2 protein levels are shown as a control. The black line indicates that intervening lanes have been spliced out. Data are representative of at least three experiments.
Figure 8.
Figure 8.
A20 is essential for restricting TRAF6 ubiquitylation. Immunoblotting analysis of endogenous TRAF6 ubiquitylation in LPS-stimulated BMDMs. A20−/− and A20+/+ BMDMs were stimulated with LPS, and cell lysates were generated at the indicated time points. Samples were boiled in 1% SDS to disassociate noncovalent protein–protein interactions. After dilution to 0.1% SDS, TRAF6 protein was immunoprecipitated from the lysates and immunoblotted for ubiquitin. Data are representative of at least three independent experiments.

Similar articles

Cited by

References

    1. Hooper, L.V., and J.I. Gordon. 2001. Commensal host-bacterial relationships in the gut. Science. 292:1115–1118. - PubMed
    1. Rakoff-Nahoum, S., J. Paglino, F. Eslami-Varzaneh, S. Edberg, and R. Medzhitov. 2004. Recognition of commensal microflora by toll-like receptors is required for intestinal homeostasis. Cell. 118:229–241. - PubMed
    1. Rakoff-Nahoum, S., L. Hao, and R. Medzhitov. 2006. Role of toll-like receptors in spontaneous commensal-dependent colitis. Immunity. 25:319–329. - PubMed
    1. Ting, J.P., D.L. Kastner, and H.M. Hoffman. 2006. CATERPILLERs, pyrin and hereditary immunological disorders. Nat. Rev. Immunol. 6:183–195. - PubMed
    1. Takeda, K., and S. Akira. 2004. Microbial recognition by Toll-like receptors. J. Dermatol. Sci. 34:73–82. - PubMed

Publication types

MeSH terms

Substances