Deciphering human immunodeficiency virus type 1 transmission and early envelope diversification by single-genome amplification and sequencing
- PMID: 18256145
- PMCID: PMC2293010
- DOI: 10.1128/JVI.02660-07
Deciphering human immunodeficiency virus type 1 transmission and early envelope diversification by single-genome amplification and sequencing
Abstract
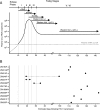
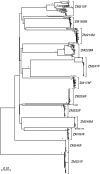
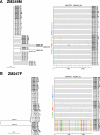
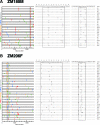
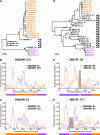
Accurate identification of the transmitted virus and sequences evolving from it could be instrumental in elucidating the transmission of human immunodeficiency virus type 1 (HIV-1) and in developing vaccines, drugs, or microbicides to prevent infection. Here we describe an experimental approach to analyze HIV-1 env genes as intact genetic units amplified from plasma virion RNA by single-genome amplification (SGA), followed by direct sequencing of uncloned DNA amplicons. We show that this strategy precludes in vitro artifacts caused by Taq-induced nucleotide substitutions and template switching, provides an accurate representation of the env quasispecies in vivo, and has an overall error rate (including nucleotide misincorporation, insertion, and deletion) of less than 8 x 10(-5). Applying this method to the analysis of virus in plasma from 12 Zambian subjects from whom samples were obtained within 3 months of seroconversion, we show that transmitted or early founder viruses can be identified and that molecular pathways and rates of early env diversification can be defined. Specifically, we show that 8 of the 12 subjects were each infected by a single virus, while 4 others acquired more than one virus; that the rate of virus evolution in one subject during an 80-day period spanning seroconversion was 1.7 x 10(-5) substitutions per site per day; and that evidence of strong immunologic selection can be seen in Env and overlapping Rev sequences based on nonrandom accumulation of nonsynonymous mutations. We also compared the results of the SGA approach with those of more-conventional bulk PCR amplification methods performed on the same patient samples and found that the latter is associated with excessive rates of Taq-induced recombination, nucleotide misincorporation, template resampling, and cloning bias. These findings indicate that HIV-1 env genes, other viral genes, and even full-length viral genomes responsible for productive clinical infection can be identified by SGA analysis of plasma virus sampled at intervals typical in large-scale vaccine trials and that pathways of viral diversification and immune escape can be determined accurately.
Figures



Similar articles
-
Identification and characterization of transmitted and early founder virus envelopes in primary HIV-1 infection.Proc Natl Acad Sci U S A. 2008 May 27;105(21):7552-7. doi: 10.1073/pnas.0802203105. Epub 2008 May 19. Proc Natl Acad Sci U S A. 2008. PMID: 18490657 Free PMC article.
-
Origin and evolution of HIV-1 in breast milk determined by single-genome amplification and sequencing.J Virol. 2011 Mar;85(6):2751-63. doi: 10.1128/JVI.02316-10. Epub 2010 Dec 29. J Virol. 2011. PMID: 21191008 Free PMC article.
-
Molecular clock of HIV-1 envelope genes under early immune selection.Retrovirology. 2016 Jun 1;13(1):38. doi: 10.1186/s12977-016-0269-6. Retrovirology. 2016. PMID: 27246201 Free PMC article.
-
Genetic identity, biological phenotype, and evolutionary pathways of transmitted/founder viruses in acute and early HIV-1 infection.J Exp Med. 2009 Jun 8;206(6):1273-89. doi: 10.1084/jem.20090378. Epub 2009 Jun 1. J Exp Med. 2009. PMID: 19487424 Free PMC article.
-
HIV evolution in early infection: selection pressures, patterns of insertion and deletion, and the impact of APOBEC.PLoS Pathog. 2009 May;5(5):e1000414. doi: 10.1371/journal.ppat.1000414. Epub 2009 May 8. PLoS Pathog. 2009. PMID: 19424423 Free PMC article.
Cited by
-
Rapid, complex adaptation of transmitted HIV-1 full-length genomes in subtype C-infected individuals with differing disease progression.AIDS. 2013 Feb 20;27(4):507-18. doi: 10.1097/QAD.0b013e32835cab64. AIDS. 2013. PMID: 23370465 Free PMC article.
-
A VRC13-like bNAb response is associated with complex escape pathways in HIV-1 envelope.J Virol. 2024 Mar 19;98(3):e0172023. doi: 10.1128/jvi.01720-23. Epub 2024 Feb 27. J Virol. 2024. PMID: 38412036 Free PMC article.
-
The Expression of Functional Vpx during Pathogenic SIVmac Infections of Rhesus Macaques Suppresses SAMHD1 in CD4+ Memory T Cells.PLoS Pathog. 2015 May 21;11(5):e1004928. doi: 10.1371/journal.ppat.1004928. eCollection 2015 May. PLoS Pathog. 2015. PMID: 25996507 Free PMC article.
-
Evaluating the Intactness of Persistent Viral Genomes in Simian Immunodeficiency Virus-Infected Rhesus Macaques after Initiating Antiretroviral Therapy within One Year of Infection.J Virol. 2019 Dec 12;94(1):e01308-19. doi: 10.1128/JVI.01308-19. Print 2019 Dec 12. J Virol. 2019. PMID: 31597776 Free PMC article.
-
HIV-1 Central Nervous System Compartmentalization and Cytokine Interplay in Non-Subtype B HIV-1 Infections in Nigeria and Malawi.AIDS Res Hum Retroviruses. 2020 Jun;36(6):490-500. doi: 10.1089/AID.2019.0245. Epub 2020 Feb 17. AIDS Res Hum Retroviruses. 2020. PMID: 31914800 Free PMC article.
References
-
- Allen, S., J. Meinzen-Derr, M. Kautzman, I. Zulu, S. Trask, U. Fideli, R. Musonda, F. Kasolo, F. Gao, and A. Haworth. 2003. Sexual behavior of HIV discordant couples after HIV counseling and testing. AIDS 17733-740. - PubMed
-
- Bernardin, F., B. L. Herring, L. Peddada, and E. L. Delwart. 2003. Primary infection of a male plasma donor with divergent HIV variants from the same source followed by rapid fluctuations in their relative frequency and viral recombination. AIDS Res. Hum. Retrovir. 191009-1015. - PubMed
-
- Clark, S. J., M. S. Saag, W. D. Decker, S. Campbell-Hill, J. L. Roberson, P. J. Veldkamp, J. C. Kappes, B. H. Hahn, and G. M. Shaw. 1991. High titers of cytopathic virus in plasma of patients with symptomatic primary HIV-1 infection. N. Engl. J. Med. 324954-960. - PubMed
-
- Delwart, E. L., M. Magierowska, M. Royz, B. Foley, L. Peddada, R. Smith, C. Heldebrand, A. Conrad, and M. P. Busch. 2001. Homogeneous quasispecies in 16 out of 17 individuals during very early HIV-1 primary infection. AIDS 151-7. - PubMed
-
- Derdeyn, C. A., J. M. Decker, F. Bibollet-Ruche, J. L. Mokili, M. Muldoon, S. A. Denham, M. L. Heil, F. Kasolo, R. Musonda, B. H. Hahn, G. M. Shaw, B. T. Korber, S. Allen, and E. Hunter. 2004. Envelope-constrained neutralization-sensitive HIV-1 after heterosexual transmission. Science 3032019-2022. - PubMed
Publication types
MeSH terms
Substances
Associated data
- Actions
- Actions
- Actions
- Actions
- Actions
- Actions
- Actions
- Actions
- Actions
- Actions
- Actions
- Actions
- Actions
- Actions
- Actions
- Actions
- Actions
- Actions
- Actions
- Actions
- Actions
- Actions
- Actions
- Actions
- Actions
- Actions
- Actions
- Actions
- Actions
- Actions
- Actions
- Actions
- Actions
- Actions
- Actions
- Actions
- Actions
- Actions
- Actions
- Actions
- Actions
- Actions
- Actions
- Actions
- Actions
- Actions
- Actions
- Actions
- Actions
- Actions
- Actions
- Actions
- Actions
- Actions
- Actions
- Actions
- Actions
- Actions
- Actions
- Actions
- Actions
- Actions
- Actions
- Actions
- Actions
- Actions
- Actions
- Actions
- Actions
- Actions
- Actions
- Actions
- Actions
- Actions
- Actions
- Actions
- Actions
- Actions
- Actions
- Actions
- Actions
- Actions
- Actions
- Actions
- Actions
- Actions
- Actions
- Actions
- Actions
- Actions
- Actions
- Actions
- Actions
- Actions
- Actions
- Actions
- Actions
- Actions
- Actions
- Actions
- Actions
- Actions
- Actions
- Actions
- Actions
- Actions
- Actions
- Actions
- Actions
- Actions
- Actions
- Actions
- Actions
- Actions
- Actions
- Actions
- Actions
- Actions
- Actions
- Actions
- Actions
- Actions
- Actions
- Actions
- Actions
- Actions
- Actions
- Actions
- Actions
- Actions
- Actions
- Actions
- Actions
- Actions
- Actions
- Actions
- Actions
- Actions
- Actions
- Actions
- Actions
- Actions
- Actions
- Actions
- Actions
- Actions
- Actions
- Actions
- Actions
- Actions
- Actions
- Actions
- Actions
- Actions
- Actions
- Actions
- Actions
- Actions
- Actions
- Actions
- Actions
- Actions
- Actions
- Actions
- Actions
- Actions
- Actions
- Actions
- Actions
- Actions
- Actions
- Actions
- Actions
- Actions
- Actions
- Actions
- Actions
- Actions
- Actions
- Actions
- Actions
- Actions
- Actions
- Actions
- Actions
- Actions
- Actions
- Actions
- Actions
- Actions
- Actions
- Actions
- Actions
- Actions
- Actions
- Actions
- Actions
- Actions
- Actions
- Actions
- Actions
- Actions
- Actions
- Actions
- Actions
- Actions
- Actions
- Actions
- Actions
- Actions
- Actions
- Actions
- Actions
- Actions
- Actions
- Actions
- Actions
- Actions
- Actions
- Actions
- Actions
- Actions
- Actions
- Actions
- Actions
- Actions
- Actions
- Actions
- Actions
- Actions
- Actions
- Actions
- Actions
- Actions
- Actions
- Actions
- Actions
- Actions
- Actions
- Actions
- Actions
- Actions
- Actions
- Actions
- Actions
- Actions
- Actions
- Actions
- Actions
- Actions
- Actions
- Actions
- Actions
- Actions
- Actions
- Actions
- Actions
- Actions
- Actions
- Actions
- Actions
- Actions
- Actions
- Actions
- Actions
- Actions
- Actions
- Actions
- Actions
- Actions
- Actions
- Actions
- Actions
- Actions
- Actions
- Actions
- Actions
- Actions
- Actions
- Actions
- Actions
- Actions
- Actions
- Actions
- Actions
- Actions
- Actions
- Actions
- Actions
- Actions
- Actions
- Actions
- Actions
- Actions
- Actions
- Actions
- Actions
- Actions
- Actions
- Actions
- Actions
- Actions
- Actions
- Actions
- Actions
- Actions
- Actions
- Actions
- Actions
- Actions
- Actions
- Actions
- Actions
- Actions
- Actions
- Actions
- Actions
- Actions
- Actions
- Actions
- Actions
- Actions
- Actions
- Actions
- Actions
- Actions
- Actions
- Actions
- Actions
- Actions
- Actions
- Actions
- Actions
- Actions
- Actions
- Actions
- Actions
- Actions
- Actions
- Actions
- Actions
- Actions
- Actions
- Actions
- Actions
- Actions
- Actions
- Actions
- Actions
- Actions
- Actions
- Actions
- Actions
- Actions
- Actions
- Actions
- Actions
- Actions
- Actions
- Actions
- Actions
- Actions
- Actions
- Actions
- Actions
- Actions
- Actions
- Actions
- Actions
- Actions
- Actions
- Actions
- Actions
- Actions
- Actions
- Actions
- Actions
- Actions
- Actions
- Actions
- Actions
- Actions
- Actions
- Actions
- Actions
- Actions
- Actions
- Actions
- Actions
- Actions
- Actions
- Actions
- Actions
- Actions
- Actions
- Actions
- Actions
- Actions
- Actions
- Actions
- Actions
- Actions
- Actions
- Actions
- Actions
- Actions
- Actions
- Actions
- Actions
- Actions
- Actions
- Actions
- Actions
- Actions
- Actions
- Actions
- Actions
- Actions
- Actions
- Actions
- Actions
- Actions
- Actions
- Actions
- Actions
- Actions
- Actions
- Actions
- Actions
- Actions
- Actions
- Actions
- Actions
- Actions
- Actions
- Actions
- Actions
- Actions
- Actions
- Actions
- Actions
- Actions
- Actions
- Actions
- Actions
- Actions
- Actions
- Actions
- Actions
- Actions
- Actions
- Actions
- Actions
- Actions
- Actions
- Actions
- Actions
- Actions
- Actions
- Actions
- Actions
- Actions
- Actions
- Actions
- Actions
- Actions
- Actions
- Actions
- Actions
- Actions
- Actions
- Actions
- Actions
- Actions
- Actions
- Actions
- Actions
- Actions
- Actions
- Actions
- Actions
- Actions
- Actions
- Actions
- Actions
- Actions
- Actions
- Actions
- Actions
- Actions
- Actions
- Actions
- Actions
- Actions
- Actions
- Actions
- Actions
- Actions
- Actions
- Actions
- Actions
- Actions
- Actions
- Actions
- Actions
- Actions
- Actions
- Actions
- Actions
- Actions
- Actions
- Actions
- Actions
- Actions
- Actions
- Actions
- Actions
- Actions
- Actions
Grants and funding
LinkOut - more resources
Full Text Sources
Other Literature Sources
Molecular Biology Databases

