Short-lived infected cells support virus replication in sooty mangabeys naturally infected with simian immunodeficiency virus: implications for AIDS pathogenesis
- PMID: 18216113
- PMCID: PMC2268472
- DOI: 10.1128/JVI.02408-07
Short-lived infected cells support virus replication in sooty mangabeys naturally infected with simian immunodeficiency virus: implications for AIDS pathogenesis
Abstract
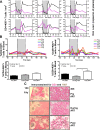
Sooty mangabeys (SMs) naturally infected with simian immunodeficiency virus (SIV) do not develop AIDS despite high levels of virus replication. At present, the mechanisms underlying this disease resistance are poorly understood. Here we tested the hypothesis that SIV-infected SMs avoid immunodeficiency as a result of virus replication occurring in infected cells that live significantly longer than human immunodeficiency virus (HIV)-infected human cells. To this end, we treated six SIV-infected SMs with potent antiretroviral therapy (ART) and longitudinally measured the decline in plasma viremia. We applied the same mathematical models used in HIV-infected individuals and observed that SMs naturally infected with SIV also present a two-phase decay of viremia following ART, with the bulk (92 to 99%) of virus replication sustained by short-lived cells (average life span, 1.06 days), and only 1 to 8% occurring in longer-lived cells. In addition, we observed that ART had a limited impact on CD4(+) T cells and the prevailing level of T-cell activation and proliferation in SIV-infected SMs. Collectively, these results suggest that in SIV-infected SMs, similar to HIV type 1-infected humans, short-lived activated CD4(+) T cells, rather than macrophages, are the main source of virus production. These findings indicate that a short in vivo life span of infected cells is a common feature of both pathogenic and nonpathogenic primate lentivirus infections and support a model for AIDS pathogenesis whereby the direct killing of infected cells by HIV is not the main determinant of disease progression.
Figures


Similar articles
-
Antiretroviral Therapy in Simian Immunodeficiency Virus-Infected Sooty Mangabeys: Implications for AIDS Pathogenesis.J Virol. 2016 Jul 27;90(16):7541-7551. doi: 10.1128/JVI.00598-16. Print 2016 Aug 15. J Virol. 2016. PMID: 27279614 Free PMC article.
-
Reduced Simian Immunodeficiency Virus Replication in Macrophages of Sooty Mangabeys Is Associated with Increased Expression of Host Restriction Factors.J Virol. 2015 Oct;89(20):10136-44. doi: 10.1128/JVI.00710-15. Epub 2015 Jul 22. J Virol. 2015. PMID: 26202248 Free PMC article.
-
Increased stability and limited proliferation of CD4+ central memory T cells differentiate nonprogressive simian immunodeficiency virus (SIV) infection of sooty mangabeys from progressive SIV infection of rhesus macaques.J Virol. 2014 Apr;88(8):4533-42. doi: 10.1128/JVI.03515-13. Epub 2014 Feb 5. J Virol. 2014. PMID: 24501416 Free PMC article.
-
Naturally SIV-infected sooty mangabeys: are we closer to understanding why they do not develop AIDS?J Med Primatol. 2005 Oct;34(5-6):243-52. doi: 10.1111/j.1600-0684.2005.00122.x. J Med Primatol. 2005. PMID: 16128919 Review.
-
What can natural infection of African monkeys with simian immunodeficiency virus tell us about the pathogenesis of AIDS?AIDS Rev. 2004 Jan-Mar;6(1):40-53. AIDS Rev. 2004. PMID: 15168740 Review.
Cited by
-
Simian immunodeficiency virus SIVagm dynamics in African green monkeys.J Virol. 2008 Apr;82(7):3713-24. doi: 10.1128/JVI.02402-07. Epub 2008 Jan 23. J Virol. 2008. PMID: 18216122 Free PMC article.
-
Systems biology of natural simian immunodeficiency virus infections.Curr Opin HIV AIDS. 2012 Jan;7(1):71-8. doi: 10.1097/COH.0b013e32834dde01. Curr Opin HIV AIDS. 2012. PMID: 22134342 Free PMC article. Review.
-
Acute SIV infection in sooty mangabey monkeys is characterized by rapid virus clearance from lymph nodes and absence of productive infection in germinal centers.PLoS One. 2013;8(3):e57785. doi: 10.1371/journal.pone.0057785. Epub 2013 Mar 5. PLoS One. 2013. PMID: 23472105 Free PMC article.
-
CD8+ lymphocytes control viral replication in SIVmac239-infected rhesus macaques without decreasing the lifespan of productively infected cells.PLoS Pathog. 2010 Jan 29;6(1):e1000747. doi: 10.1371/journal.ppat.1000747. PLoS Pathog. 2010. PMID: 20126441 Free PMC article.
-
CCR5 as a Coreceptor for Human Immunodeficiency Virus and Simian Immunodeficiency Viruses: A Prototypic Love-Hate Affair.Front Immunol. 2022 Jan 27;13:835994. doi: 10.3389/fimmu.2022.835994. eCollection 2022. Front Immunol. 2022. PMID: 35154162 Free PMC article. Review.
References
-
- Autran, B., G. Carcelain, T. S. Li, C. Blanc, D. Mathez, R. Tubiana, C. Katlama, P. Debre, and J. Leibowitch. 1997. Positive effects of combined antiretroviral therapy on CD4+ T cell homeostasis and function in advanced HIV disease. Science 277112-116. - PubMed
-
- Bostik, P., A. E. Mayne, F. Villinger, K. P. Greenberg, J. D. Powell, and A. A. Ansari. 2001. Relative resistance in the development of T cell anergy in CD4+ T cells from simian immunodeficiency virus disease-resistant sooty mangabeys. J. Immunol. 166506-516. - PubMed
-
- Bostik, P., E. S. Noble, A. E. Mayne, L. Gargano, F. Villinger, and A. A. Ansari. 2006. Central memory CD4 T cells are the predominant cell subset resistant to anergy in SIV disease resistant sooty mangabeys. AIDS 20181-188. - PubMed
Publication types
MeSH terms
Substances
Grants and funding
- R01-AI49809/AI/NIAID NIH HHS/United States
- RR-00165/RR/NCRR NIH HHS/United States
- RR06555/RR/NCRR NIH HHS/United States
- AI64066/AI/NIAID NIH HHS/United States
- R37 AI028433/AI/NIAID NIH HHS/United States
- R21 AI060451/AI/NIAID NIH HHS/United States
- AI28433/AI/NIAID NIH HHS/United States
- R01 AI028433/AI/NIAID NIH HHS/United States
- AI66996/AI/NIAID NIH HHS/United States
- 1F31A1066400-01A1/PHS HHS/United States
- R01 HL075766/HL/NHLBI NIH HHS/United States
- N01CO12400/CA/NCI NIH HHS/United States
- R01 AI049809/AI/NIAID NIH HHS/United States
- HL75766/HL/NHLBI NIH HHS/United States
- N01-CO-12400/CO/NCI NIH HHS/United States
- R01 AI064066/AI/NIAID NIH HHS/United States
- AI60451/AI/NIAID NIH HHS/United States
- AI52755/AI/NIAID NIH HHS/United States
- P51 RR000165/RR/NCRR NIH HHS/United States
- AI65325/AI/NIAID NIH HHS/United States
- R01 RR006555/RR/NCRR NIH HHS/United States
- R01 AI065325/AI/NIAID NIH HHS/United States
- R01 AI052755/AI/NIAID NIH HHS/United States
LinkOut - more resources
Full Text Sources
Research Materials
Miscellaneous

