Cooperative signaling through the signal transducer and activator of transcription 3 and nuclear factor-{kappa}B pathways in subtypes of diffuse large B-cell lymphoma
- PMID: 18160665
- PMCID: PMC2275028
- DOI: 10.1182/blood-2007-09-111948
Cooperative signaling through the signal transducer and activator of transcription 3 and nuclear factor-{kappa}B pathways in subtypes of diffuse large B-cell lymphoma
Abstract
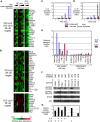
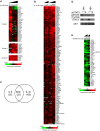
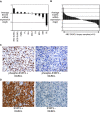
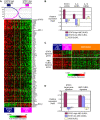
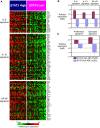
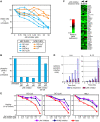
The activated B cell-like (ABC) subgroup of diffuse large B-cell lymphoma (DLBCL) is characterized by constitutive activation of the nuclear factor-kappaB (NF-kappaB) pathway. In this study, we showed that the NF-kappaB pathway induced the expression of the cytokines interleukin (IL)-6 and IL-10 in ABC DLBCL cell lines, which also have high levels of total and phosphorylated signal transducer and activator of transcription (STAT) 3 protein, suggesting autocrine signaling. Using RNA interference for STAT3, we defined a gene expression signature of IL-6 and IL-10 signaling through STAT3. Based on this signature, we constructed a molecular predictor of STAT3 signaling that defined a subset of ABC DLBCL tumors with high expression of STAT3, IL-6, and/or IL-10 and their downstream targets. Although the STAT3-high and STAT3-low subsets had equivalent expression of genes that distinguish ABC DLBCL from germinal center B cell-like DLBCL, STAT3-high ABC DLBCLs had higher expression of signatures that reflected NF-kappaB activity, proliferation, and glycolysis. A small-molecule inhibitor of Janus kinase signaling, which blocked STAT3 signature expression, was toxic only for ABC DLBCL lines and synergized with an inhibitor of NF-kappaB signaling. These findings suggest that the biological interplay between the STAT3 and NF-kappaB pathways may be exploited for the treatments of a subset of ABC DLBCLs.
Figures

Similar articles
-
Oncogenically active MYD88 mutations in human lymphoma.Nature. 2011 Feb 3;470(7332):115-9. doi: 10.1038/nature09671. Epub 2010 Dec 22. Nature. 2011. PMID: 21179087 Free PMC article.
-
Dimethyl fumarate induces ferroptosis and impairs NF-κB/STAT3 signaling in DLBCL.Blood. 2021 Sep 9;138(10):871-884. doi: 10.1182/blood.2020009404. Blood. 2021. PMID: 33876201
-
Compensatory IKKalpha activation of classical NF-kappaB signaling during IKKbeta inhibition identified by an RNA interference sensitization screen.Proc Natl Acad Sci U S A. 2008 Dec 30;105(52):20798-803. doi: 10.1073/pnas.0806491106. Epub 2008 Dec 22. Proc Natl Acad Sci U S A. 2008. PMID: 19104039 Free PMC article.
-
B-cell receptor signaling in diffuse large B-cell lymphoma.Semin Hematol. 2015 Apr;52(2):77-85. doi: 10.1053/j.seminhematol.2015.01.008. Epub 2015 Jan 15. Semin Hematol. 2015. PMID: 25805587 Free PMC article. Review.
-
[Signaling pathways in pathogenesis of diffuse large B-cell lymphoma].Zhonghua Bing Li Xue Za Zhi. 2011 Apr;40(4):282-5. Zhonghua Bing Li Xue Za Zhi. 2011. PMID: 21616012 Review. Chinese. No abstract available.
Cited by
-
Are we ready to stratify treatment for diffuse large B-cell lymphoma using molecular hallmarks?Oncologist. 2012;17(12):1562-73. doi: 10.1634/theoncologist.2012-0218. Epub 2012 Oct 18. Oncologist. 2012. PMID: 23086691 Free PMC article. Review.
-
Dynamic aberrant NF-κB spurs tumorigenesis: a new model encompassing the microenvironment.Cytokine Growth Factor Rev. 2015 Aug;26(4):389-403. doi: 10.1016/j.cytogfr.2015.06.001. Epub 2015 Jun 20. Cytokine Growth Factor Rev. 2015. PMID: 26119834 Free PMC article. Review.
-
STAT3: a target to enhance antitumor immune response.Curr Top Microbiol Immunol. 2011;344:41-59. doi: 10.1007/82_2010_51. Curr Top Microbiol Immunol. 2011. PMID: 20517723 Free PMC article. Review.
-
Diffuse large B cell lymphoma in hyper-IgE syndrome due to STAT3 mutation.J Clin Immunol. 2010 Nov;30(6):886-93. doi: 10.1007/s10875-010-9452-z. Epub 2010 Sep 22. J Clin Immunol. 2010. PMID: 20859667 Review.
-
The Immunology of DLBCL.Cancers (Basel). 2023 Jan 29;15(3):835. doi: 10.3390/cancers15030835. Cancers (Basel). 2023. PMID: 36765793 Free PMC article. Review.
References
-
- Calò V, Migliavacca M, Bazan V, et al. STAT proteins: from normal control of cellular events to tumorigenesis. J Cell Physiol. 2003;197:157–168. - PubMed
-
- Bowman T, Garcia R, Turkson J, Jove R. STATs in oncogenesis. Oncogene. 2000;19:2474–2488. - PubMed
-
- Alizadeh AA, Eisen MB, Davis RE, et al. Distinct types of diffuse large B-cell lymphoma identified by gene expression profiling. Nature. 2000;403:503–511. - PubMed
Publication types
MeSH terms
Substances
Grants and funding
LinkOut - more resources
Full Text Sources
Other Literature Sources
Molecular Biology Databases
Miscellaneous

