Role of PSIP1/LEDGF/p75 in lentiviral infectivity and integration targeting
- PMID: 18092005
- PMCID: PMC2129110
- DOI: 10.1371/journal.pone.0001340
Role of PSIP1/LEDGF/p75 in lentiviral infectivity and integration targeting
Abstract
Background: To replicate, lentiviruses such as HIV must integrate DNA copies of their RNA genomes into host cell chromosomes. Lentiviral integration is favored in active transcription units, which allows efficient viral gene expression after integration, but the mechanisms directing integration targeting are incompletely understood. A cellular protein, PSIP1/LEDGF/p75, binds tightly to the lentiviral-encoded integrase protein (IN), and has been reported to be important for HIV infectivity and integration targeting.
Methodology: Here we report studies of lentiviral integration targeting in 1) human cells with intensified RNAi knockdowns of PSIP1/LEDGF/p75, and 2) murine cells with homozygous gene trap mutations in the PSIP1/LEDGF/p75 locus. Infections with vectors derived from equine infections anemia virus (EIAV) and HIV were compared. Integration acceptor sites were analyzed by DNA bar coding and pyrosequencing.
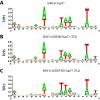
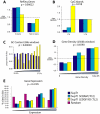
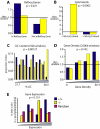
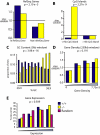
Conclusions/significance: In both PSIP1/LEDGF/p75-depleted cell lines, reductions were seen in lentiviral infectivity compared to controls. For the human cells, integration was reduced in transcription units in the knockdowns, and this reduction was greater than in our previous studies of human cells less completely depleted for PSIP1/LEDGF/p75. For the homozygous mutant mouse cells, similar reductions in integration in transcription units were seen, paralleling a previous study of a different mutant mouse line. Integration did not become random, however-integration in transcription units in both cell types was still favored, though to a reduced degree. New trends also appeared, including favored integration near CpG islands. In addition, we carried out a bioinformatic study of 15 HIV integration site data sets in different cell types, which showed that the frequency of integration in transcription units was correlated with the cell-type specific levels of PSIP1/LEDGF/p75 expression.
Conflict of interest statement
Figures


Similar articles
-
TALEN knockout of the PSIP1 gene in human cells: analyses of HIV-1 replication and allosteric integrase inhibitor mechanism.J Virol. 2014 Sep 1;88(17):9704-17. doi: 10.1128/JVI.01397-14. Epub 2014 Jun 18. J Virol. 2014. PMID: 24942577 Free PMC article.
-
LEDGF/p75 functions downstream from preintegration complex formation to effect gene-specific HIV-1 integration.Genes Dev. 2007 Jul 15;21(14):1767-78. doi: 10.1101/gad.1565107. Genes Dev. 2007. PMID: 17639082 Free PMC article.
-
Targeted editing of the PSIP1 gene encoding LEDGF/p75 protects cells against HIV infection.Sci Rep. 2019 Feb 20;9(1):2389. doi: 10.1038/s41598-019-38718-0. Sci Rep. 2019. PMID: 30787394 Free PMC article.
-
The lentiviral integrase binding protein LEDGF/p75 and HIV-1 replication.PLoS Pathog. 2008 Mar 28;4(3):e1000046. doi: 10.1371/journal.ppat.1000046. PLoS Pathog. 2008. PMID: 18369482 Free PMC article. Review.
-
Host factors for retroviral integration site selection.Trends Biochem Sci. 2015 Feb;40(2):108-16. doi: 10.1016/j.tibs.2014.12.001. Epub 2014 Dec 31. Trends Biochem Sci. 2015. PMID: 25555456 Review.
Cited by
-
Going beyond Integration: The Emerging Role of HIV-1 Integrase in Virion Morphogenesis.Viruses. 2020 Sep 9;12(9):1005. doi: 10.3390/v12091005. Viruses. 2020. PMID: 32916894 Free PMC article. Review.
-
Psip1/Ledgf p52 binds methylated histone H3K36 and splicing factors and contributes to the regulation of alternative splicing.PLoS Genet. 2012;8(5):e1002717. doi: 10.1371/journal.pgen.1002717. Epub 2012 May 17. PLoS Genet. 2012. PMID: 22615581 Free PMC article.
-
Synthesis and Evaluation of Aryl Quinolines as HIV-1 Integrase Multimerization Inhibitors.ACS Med Chem Lett. 2018 Sep 14;9(10):1007-1012. doi: 10.1021/acsmedchemlett.8b00269. eCollection 2018 Oct 11. ACS Med Chem Lett. 2018. PMID: 30344908 Free PMC article.
-
Mass spectrometry-based footprinting of protein-protein interactions.Methods. 2009 Apr;47(4):304-7. doi: 10.1016/j.ymeth.2008.10.023. Epub 2008 Nov 17. Methods. 2009. PMID: 19015031 Free PMC article.
-
Integrase and integration: biochemical activities of HIV-1 integrase.Retrovirology. 2008 Dec 17;5:114. doi: 10.1186/1742-4690-5-114. Retrovirology. 2008. PMID: 19091057 Free PMC article. Review.
References
-
- Coffin JM, Hughes SH, Varmus HE. Retroviruses. Cold Spring Harbor: Cold Spring Harbor Laboratory Press; 1997. - PubMed
-
- Bushman FD. Lateral DNA transfer: Mechanisms and consequences. Cold Spring Harbor, NY: Cold Spring Harbor Laboratory Press; 2001.
Publication types
MeSH terms
Substances
Grants and funding
- AI66290/AI/NIAID NIH HHS/United States
- T32 AI007632/AI/NIAID NIH HHS/United States
- U19 AI066290/AI/NIAID NIH HHS/United States
- AI007632/AI/NIAID NIH HHS/United States
- R01 AI047536/AI/NIAID NIH HHS/United States
- T32 07229-33/PHS HHS/United States
- R01 AI052845/AI/NIAID NIH HHS/United States
- MC_U127527202/MRC_/Medical Research Council/United Kingdom
- AI47536/AI/NIAID NIH HHS/United States
- R01 AI077344/AI/NIAID NIH HHS/United States
- R21 AI047536/AI/NIAID NIH HHS/United States
- AI52845/AI/NIAID NIH HHS/United States
LinkOut - more resources
Full Text Sources
Other Literature Sources
Research Materials

