. 2007 Dec 12:4:89.
doi: 10.1186/1742-4690-4-89.

Asn 362 in gp120 contributes to enhanced fusogenicity by CCR5-restricted HIV-1 envelope glycoprotein variants from patients with AIDS

Affiliations

Asn 362 in gp120 contributes to enhanced fusogenicity by CCR5-restricted HIV-1 envelope glycoprotein variants from patients with AIDS

Jasminka Sterjovski et al. Retrovirology. .

Abstract

Background: CCR5-restricted (R5) human immunodeficiency virus type 1 (HIV-1) variants cause CD4+ T-cell loss in the majority of individuals who progress to AIDS, but mechanisms underlying the pathogenicity of R5 strains are poorly understood. To better understand envelope glycoprotein (Env) determinants contributing to pathogenicity of R5 viruses, we characterized 37 full-length R5 Envs from cross-sectional and longitudinal R5 viruses isolated from blood of patients with asymptomatic infection or AIDS, referred to as pre-AIDS (PA) and AIDS (A) R5 Envs, respectively.

Results: Compared to PA-R5 Envs, A-R5 Envs had enhanced fusogenicity in quantitative cell-cell fusion assays, and reduced sensitivity to inhibition by the fusion inhibitor T-20. Sequence analysis identified the presence of Asn 362 (N362), a potential N-linked glycosylation site immediately N-terminal to CD4-binding site (CD4bs) residues in the C3 region of gp120, more frequently in A-R5 Envs than PA-R5 Envs. N362 was associated with enhanced fusogenicity, faster entry kinetics, and increased sensitivity of Env-pseudotyped reporter viruses to neutralization by the CD4bs-directed Env mAb IgG1b12. Mutagenesis studies showed N362 contributes to enhanced fusogenicity of most A-R5 Envs. Molecular models indicate N362 is located adjacent to the CD4 binding loop of gp120, and suggest N362 may enhance fusogenicity by promoting greater exposure of the CD4bs and/or stabilizing the CD4-bound Env structure.

Conclusion: Enhanced fusogenicity is a phenotype of the A-R5 Envs studied, which was associated with the presence of N362, enhanced HIV-1 entry kinetics and increased CD4bs exposure in gp120. N362 contributes to fusogenicity of R5 Envs in a strain dependent manner. Our studies suggest enhanced fusogenicity of A-R5 Envs may contribute to CD4+ T-cell loss in subjects who progress to AIDS whilst harbouring R5 HIV-1 variants. N362 may contribute to this effect in some individuals.


Figures

Figure 1
Figure 1
Expression of functional Env clones. 293T cells were cotransfected with 8 μg of pSVIII-Env plasmid expressing control R5 Envs (A) or pSVIII-Env plasmid expressing functional Envs cloned from the cross sectional (PA-R5 viruses NB23, NB24, NB25, NB27 and A-R5 viruses NB2, NB6, NB7, NB8) (B) or longitudinal (PA- and A-R5 viruses from subject IK1) (C) primary R5 HIV-1 isolates and 2 μg pSVL-Tat, as described in the Methods. Env expression at 72 h post-transfection was measured by Western blot analysis of cell lysates using rabbit anti-gp120 polyclonal antisera. Positions of gp160 and gp120 are shown on the right. C1, C2, C3 and C4 refer to independent Envs cloned from each virus.
Figure 2
Figure 2
Fusogenicity of PA-R5 and A-R5 Envs cloned from the cross-sectional panel of primary R5 HIV-1 isolates. Fusion assays were performed using 293T effector cells expressing PA-R5 and A-R5 Envs shown in Fig. 1B and Cf2-Luc target cells expressing CD4 and CCR5, as described in the Methods. Cells were harvested at 2, 4, 6, 8, 10 and 12 h post-mixing and assayed for luciferase activity (A). 293T effector cells were stained for cell surface Env expression using pooled AIDS serum and analysed by flow cytometry, as described in the Methods (B). The data were stratified by different maximal levels of fusion scored as +/-, +, ++, and +++, which correspond to <10-fold (very low), 10- to 20-fold (low), 20- to 40-fold (moderate), and >40-fold (high) increases in luciferase activity above background levels, respectively (C). Box plots were constructed from mean values of duplicate experiments with each Env using Prism version 4.0c (GraphPad Software, San Diego, CA.). Boxes represent upper and lower quartiles and median scores, and whiskers represent minimum and maximum values. The data shown are representative of 3 independent experiments. P values were calculated using a nonparametric Mann-Whitney U test, and values <0.05 were considered statistically significant.
Figure 3
Figure 3
Fusogenicity of PA-R5 and A-R5 Envs cloned from longitudinal primary R5 HIV-1 isolates. Fusion assays were performed using 293T effector cells expressing PA-R5 and A-R5 Envs cloned from longitudinal viruses isolated from subject IK1 shown in Fig. 1C, and Cf2-Luc target cells expressing CD4 and CCR5 as described in the Methods. Cells were harvested at 2, 4, 6, 8, 10 and 12 h post-mixing and assayed for luciferase activity (A). 293T effector cells expressing Envs were stained for cell surface Env expression using pooled AIDS serum and analysed by flow cytometry, as described in the Methods (B). Box plots were constructed from mean values of duplicate experiments with each Env using Prism version 4.0c (GraphPad Software). Boxes represent upper and lower quartiles and median scores, and whiskers represent minimum and maximum values. The data shown are representative of 3 independent experiments. P values were calculated using a nonparametric Mann-Whitney U test, and values < 0.05 were considered statistically significant.
Figure 4
Figure 4
Sensitivity of PA-R5 and A-R5 Envs to inhibition by T-20. Fusion assays were performed using 293T effector cells expressing PA-R5 and A-R5 Envs from the cross sectional panel of primary R5 HIV-1 isolates shown in Fig. 1A, and Cf2-Luc target cells expressing CD4 and CCR5 in the presence of 10-fold increasing concentrations of T-20 ranging from 0.001 to 10 μg per ml, as described in the Methods. IC50 (A) and IC80 (B) values were calculated by least squares analysis of inhibition curves. IC80 values were calculated instead of IC90 values, because 90% inhibition of fusion was not reached when these concentrations of T-20 were tested against some of the A-R5 Envs (data not shown). 293T effector cells were stained for cell surface Env expression using pooled AIDS serum and analysed by flow cytometry, as described in the Methods (C). Box plots were constructed from mean values of duplicate experiments with each Env using Prism version 4.0c (GraphPad Software). Boxes represent upper and lower quartiles and median scores, and whiskers represent minimum and maximum values. The data shown are representative of 3 independent experiments. P values were calculated using a nonparametric Mann-Whitney U test, and values < 0.05 were considered statistically significant.
Figure 5
Figure 5
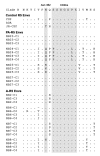
Amino acid sequences spanning the CD4bs in the C3 region of gp120. Amino acid alignments of the C3 region of PA-R5 and A-R5 Envs cloned from the cross sectional panel of primary HIV-1 isolates are compared to those from the highly fusogenic YU2 and ADA R5 Envs, the poorly fusogenic JR-CSF R5 Env, and the clade B consensus sequence. Dots indicate residues identical to the clade B consensus sequence, and dashes indicate gaps. Residues forming the CD4bs and the amino acid present at position 362 (numbered relative to the HXB2 reference sequence) are highlighted.
Figure 6
Figure 6
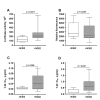
N362 is associated with enhanced fusogenicity and reduced sensitivity to T-20. For each of the Envs cloned from the cross sectional panel of primary R5 HIV-1 viruses, the maximal levels of fusion (determined at 12 h post-fusion) (A), cell surface Env expression on 293T effector cells (B), and IC50 (C) and IC80 (D) values for sensitivity to inhibition by T-20, were stratified based on the presence or absence of N362. Box plots were constructed from mean values of duplicate experiments with each Env using Prism version 4.0c (GraphPad Software). Boxes represent upper and lower quartiles and median scores, and whiskers represent minimum and maximum values. The data shown are representative of 3 independent experiments.
Figure 7
Figure 7
Structural modelling of N362. Structures of the unliganded SIV gp120 (A) and CD4-bound JR-FL gp120 (B). The β-14 (cyan), β-18 (pink) and β-24 strands (green) are highlighted. The CD4 binding loop is highlighted in purple. Asn362 (Thr378 in SIV) is labelled (cyan). Elements of the bridging sheet are highlighted in red. Potential hydrogen bond donors for N362 within the β-14, β-18 and β-24 strands are shown in (C) and are colored as in (A) and (B). CD4 residues contacting the CD4bs of gp120 are colored in yellow, and the molecular surface of Phe43 of CD4 is shown to illustrate the "Phe43 pocket" of the gp120 binding site of CD4. N362 is labelled and highlighted in red. Putative hydrogen bond partners are labelled in grey. Hydrogen bonds are depicted as dotted green lines. For simplicity, only the N362 hydrogen bond with R465 is shown.
Figure 8
Figure 8
The relationship between N362, HIV-1 entry kinetics, and sensitivity to inhibition by neutralizing antibodies. Luciferase reporter viruses pseudotyped with a subset of PA-R5 Envs lacking N362 (NB24-C1, NB24-C2, NB24-C3, NB24-C4, NB25-C2, and NB25-C4) or with a subset of A-R5 Envs containing N362 (NB6-C2, NB6-C3, NB6-C4, NB7-C2, NB7-C4, NB8-C2 and NB8-C4) were produced and quantified as described in the Methods. The kinetics of HIV-1 entry by Env-pseudotyped luciferase reporter viruses was determined by time-of-addition studies with T-20, as described in the Methods (A). The results are expressed in minutes as the maximum delay time after addition of virus to JC53 target cells when addition of 50 μg per ml of T-20 can still completely inhibit HIV-1 entry (Max. delay of entry), which was determined by least squares regression analysis of time-of-addition curves. The sensitivity of Env-pseudotyped luciferase reporter viruses to neutralization by Env monoclonal antibodies IgG1b12 (B) or 2G12 (C), or by the polyclonal antibody HIV-Ig (D) was determined by calculation of IC50 and IC90 values by least squares analysis of neutralization curves, as described in the Methods. For sensitivity to neutralization by IgG1b12, four PA-R5 Envs (NB24-C1, NB24-C2, NB24-C3, NB24-C4) had IC50 and IC90 values > 50 μg per ml, indicating resistance. These Envs were assigned values of 50 μg per ml for the purpose of constructing panel (B). Box plots were constructed from mean values of duplicate experiments with each Env-pseudotyped luciferase reporter virus using Prism version 4.0c (GraphPad Software). Boxes represent upper and lower quartiles and median scores, and whiskers represent minimum and maximum values. The data shown are representative of 2 independent experiments. P values were calculated using a nonparametric Mann-Whitney U test, and values < 0.05 were considered statistically significant.
Figure 9
Figure 9
N362 exerts a strain-dependent enhancement of fusogenicity by R5 Envs. Western blot analysis of 293T cells transfected with wild type and Env mutants (A). Fusion assays were performed using 293T effector cells expressing equivalent levels of wild type or Env mutants generated from control R5 ADA, YU2 and JRCSF Envs (B) or from A-R5 NB2-C4, NB6-C3, NB7-C1 and NB8-C4 Envs (C), and Cf2-Luc target cells expressing CD4 and CCR5 as described in the Methods. Cells were harvested at 2, 4, 6, 8, 10 and 12 h post-mixing and assayed for luciferase activity. Results are expressed as the percentage of maximal fusion levels attained by the wild type Env clone. Means values of duplicate infections are shown. Error bars represent standard deviations. The results are representative of 2 independent experiments. P values were calculated with a paired t-test, and values < 0.05 were considered significant*. P values approaching significance are also indicated.

Similar articles

Cited by

References

    1. Berger EA, Murphy PM, Farber JM. Chemokine receptors as HIV-1 coreceptors: roles in viral entry, tropism, and disease. Annu Rev Immunol. 1999;17:657–700. doi: 10.1146/annurev.immunol.17.1.657. - DOI - PubMed
    1. Doms RW, Trono D. The plasma membrane as a combat zone in the HIV battlefield. Genes Dev. 2000;14:2677–2688. doi: 10.1101/gad.833300. - DOI - PubMed
    1. Moore JP, Kitchen SG, Pugach P, Zack JA. The CCR5 and CXCR4 coreceptors--central to understanding the transmission and pathogenesis of human immunodeficiency virus type 1 infection. AIDS Res Hum Retroviruses. 2004;20:111–126. doi: 10.1089/088922204322749567. - DOI - PubMed
    1. Connor RI, Sheridan KE, Ceradini D, Choe S, Landau NR. Change in coreceptor use coreceptor use correlates with disease progression in HIV-1--infected individuals. J Exp Med. 1997;185:621–628. doi: 10.1084/jem.185.4.621. - DOI - PMC - PubMed
    1. Bjorndal A, Deng H, Jansson M, Fiore JR, Colognesi C, Karlsson A, Albert J, Scarlatti G, Littman DR, Fenyo EM. Coreceptor usage of primary human immunodeficiency virus type 1 isolates varies according to biological phenotype. J Virol. 1997;71:7478–7487. - PMC - PubMed

Publication types