. 2007 Dec;117(12):3988-4002.
doi: 10.1172/JCI32533.

IL-6 triggers malignant features in mammospheres from human ductal breast carcinoma and normal mammary gland

Affiliations

IL-6 triggers malignant features in mammospheres from human ductal breast carcinoma and normal mammary gland

Pasquale Sansone et al. J Clin Invest. 2007 Dec.

Abstract

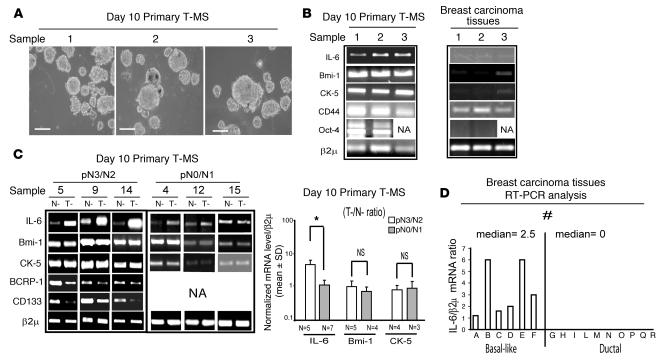
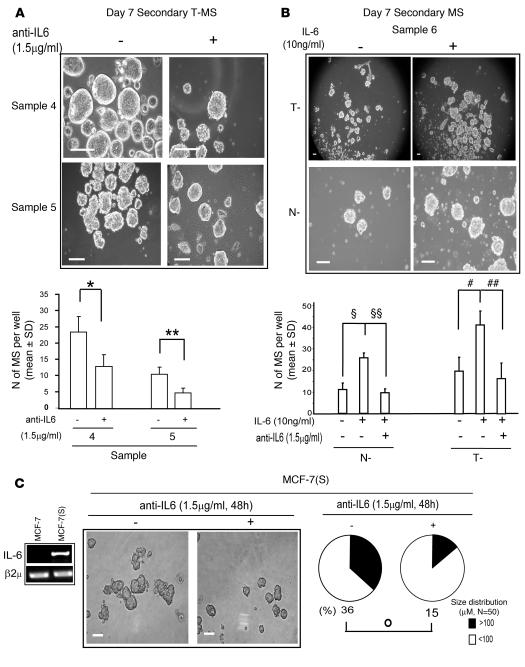
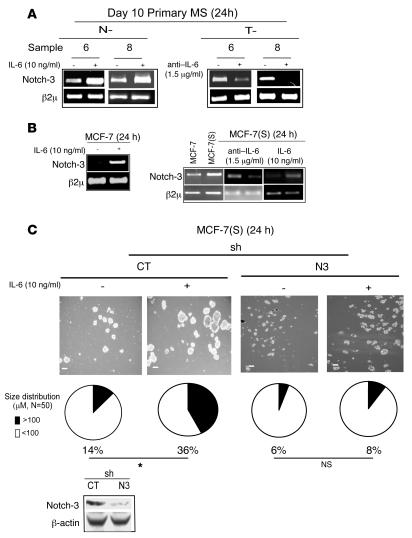
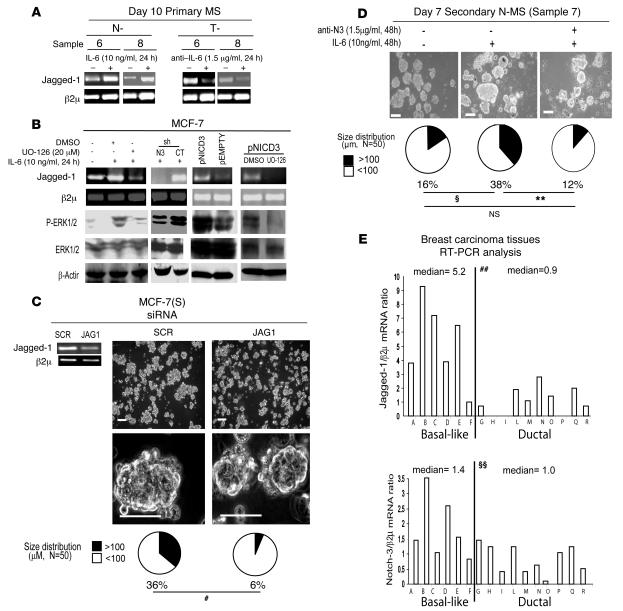
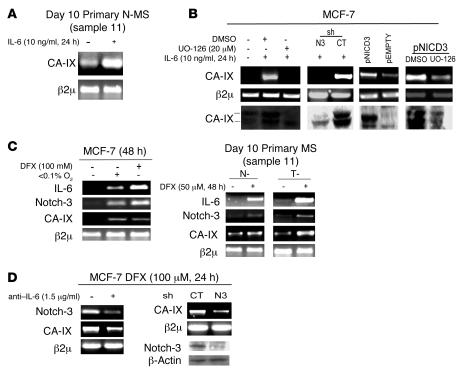
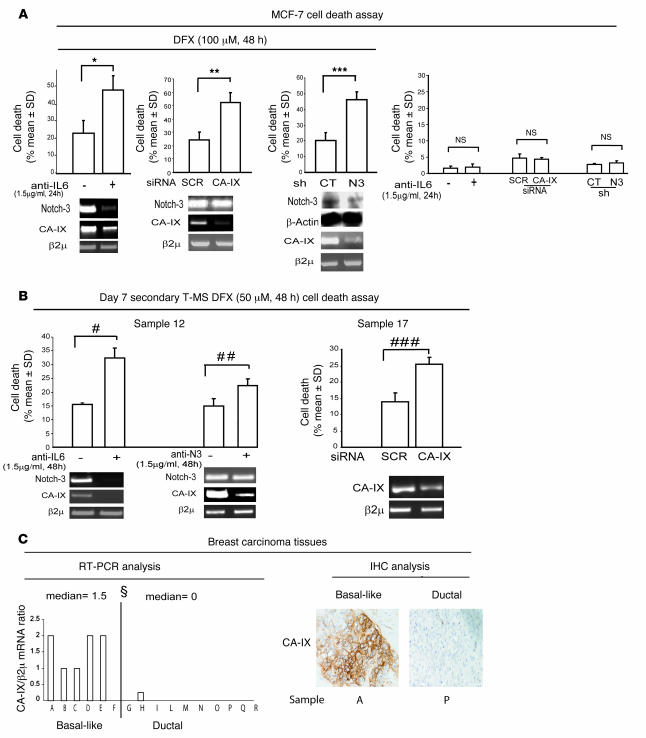
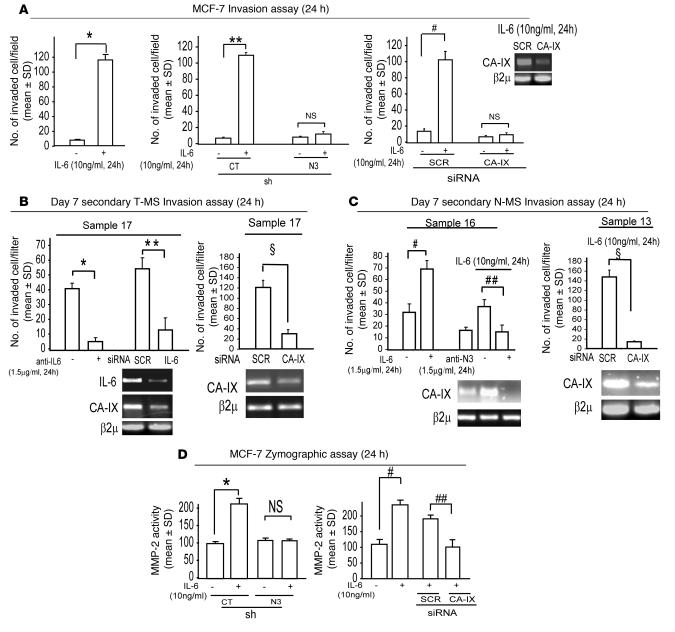
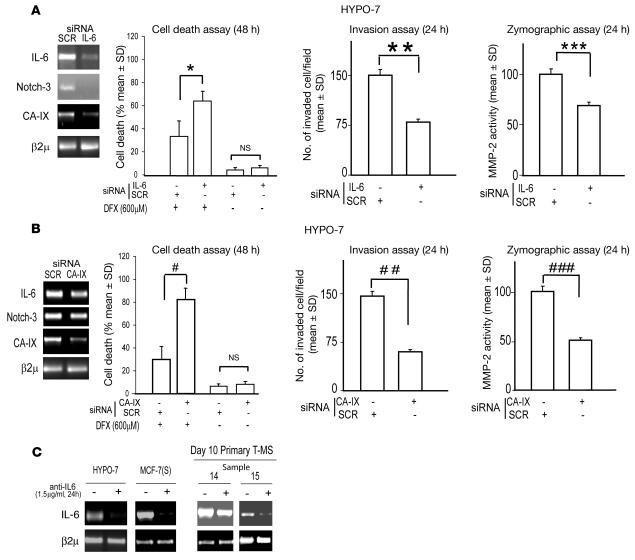
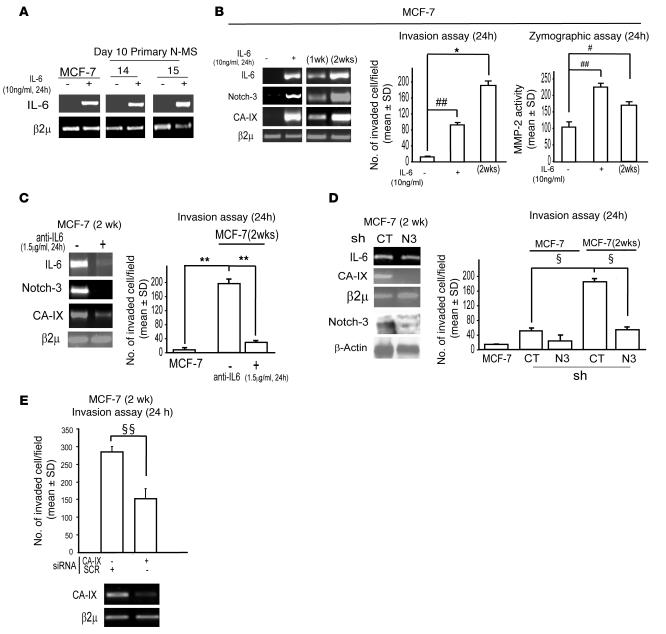
High serum levels of IL-6 correlate with poor outcome in breast cancer patients. However, no data are available on the relationship between IL-6 and mammary stem/progenitor cells, which may fuel the genesis of breast cancer in vivo. Herein, we address this issue in the MCF-7 breast cancer cell line and in primary human mammospheres (MS), multicellular structures enriched in stem/progenitor cells of the mammary gland. MS from node invasive breast carcinoma tissues expressed IL-6 mRNA at higher levels than did MS from matched non-neoplastic mammary glands. In addition, IL-6 mRNA was detected only in basal-like breast carcinoma tissues, an aggressive breast carcinoma variant showing stem cell features. IL-6 treatment triggered Notch-3-dependent upregulation of the Notch ligand Jagged-1 and promotion of MS and MCF-7-derived spheroid growth. Moreover, IL-6 induced Notch-3-dependent upregulation of the carbonic anhydrase IX gene and promoted a hypoxia-resistant/invasive phenotype in MCF-7 cells and MS. Finally, autocrine IL-6 signaling relied upon Notch-3 activity to sustain the aggressive features of MCF-7-derived hypoxia-selected cells. In conclusion, these data support the hypothesis that IL-6 induces malignant features in Notch-3-expressing stem/progenitor cells from human ductal breast carcinoma and normal mammary gland.


Figures

Figure 1
Figure 1. IL-6 mRNA is expressed in MS and in basal-like breast carcinoma tissues.
(A) Phase-contrast microscopy of day 10 primary T-MS generated from samples listed in Table 1. Scale bars: 100 μm. (B) RT-PCR analysis of IL-6, Bmi-1, CK-5, CD44, Oct-4, and β2μ mRNA in T-MS and in tumor tissues from which T-MS had been obtained. (C) Day 10 primary N-MS and T-MS were obtained from the same patient (see Table 1). RT-PCR analysis of IL-6, Bmi-1, CK-5, BCRP-1, and CD133 and quantitation of IL-6, Bmi-1, and CK-5 mRNA, first normalized onto β2μ mRNA and then expressed as a ratio of N-MS to T-MS. *P = 0.031, Mann-Whitney test. NA, not available. (D) Breast carcinoma tissues from patients affected by basal-like or ductal breast carcinoma (see Table 2) were subjected to RT-PCR analysis. Shown is the ratio of IL-6 to β2μ mRNA. #P = 0.001, Mann-Whitney test.
Figure 2
Figure 2. IL-6 sustains MS self renewal and MCF-7 spheroid formation.
(A) Day 7 secondary T-MS, generated from primary T-MS in the presence or absence of the mAb anti–IL-6, which blocks the IL-6 receptor/ligand interaction (1.5 μg/ml). Phase-contrast microscopy analysis and number of MS per well (n = 3). *P = 0.029, **P = 0.042, ANOVA. (B) Phase-contrast microscopy analysis and number of MS per well in day 7 secondary T-MS and N-MS generated from primary MS in the presence or absence of IL-6 (10 ng/ml) and anti–IL-6 (1.5 μg/ml), respectively (n = 3). ΧP = 0.027, ΧΧP = 0.020, #P = 0.048; ##P = 0.035, ANOVA plus post-hoc tests adjusted for multiple comparisons. (C) RT-PCR analysis of IL-6 mRNA in MCF-7 and day 2 MCF-7–derived spheroids and MCF-7(S) generated in the presence or absence of anti–IL-6 (1.5 μg/ml). Also shown are phase-contrast microscopy analysis and MCF-7(S) size distribution. n denotes the number of spheroids counted for each sample. °P = 0.02, Monte Carlo χ2 test. β2μ was assessed as quantitative control for RT-PCR analysis. Scale bars: 100 μm.
Figure 3
Figure 3. IL-6 induces Notch-3 gene upregulation and Notch-3–dependent MCF-7(S) formation.
(A) RT-PCR analysis of Notch-3 mRNA in day 10 primary N-MS in the presence or absence of IL-6 (10 ng/ml) and in T-MS in the presence or absence of anti–IL-6 (1.5 μg/ml) for 24 hours. (B) RT-PCR analysis of Notch-3 mRNA in MCF-7 cells cultured in the presence or absence of IL-6 (10 ng/ml) and in MCF-7(S) in the presence or absence of anti–IL-6 (1.5 μg/ml) or IL-6 (10 ng/ml) for 24 hours. (C) Day 7 MCF-7(S) generated from MCF-7 cells infected with a pSuper­Puro retroviral vector encoding a Notch-3-specific (N3) or control (CT) shRNA (sh) in the presence or absence of IL-6 (10 ng/ml). Phase-contrast microscopy analysis, MCF-7(S) size distribution (n denotes number of spheroids counted per sample), and Western blot analysis of Notch-3 and β-actin protein levels. *P = 0.034, Monte Carlo χ2test. β2μ was assessed as quantitative control for RT-PCR analysis. Scale bars: 100 μm.
Figure 4
Figure 4. Notch-3/Jagged-1 interplay sustains MCF-7(S) formation and MS self-renewal.
(A) Day 10 primary N-MS and T-MS cultured in the presence or absence of IL-6 (10 ng/ml) or anti–IL-6 (1.5 μg/ml) for 24 hours. RT-PCR analysis of Jagged-1 mRNA. (B) RT-PCR analysis of Jagged-1 mRNA and Western blot analysis of phosphorylated ERK and total ERK protein in MCF-7 cells exposed to IL-6 (10 ng/ml) in the presence or absence of the MEK1 inhibitor UO-126 (20 μM) or DMSO for 24 hours, in shNotch-3 and control MCF-7 cells exposed to IL-6 (10 ng/ml for 24 hours), in MCF-7 cells transfected with 1 μg pNICD3 or empty control vector (pEMPTY) for 24 hours, and in MCF-7 cells transfected with pNICD3 in the presence or absence of UO-126 (20 μM) or DMSO. (C) Day 7 MCF-7(S) generated from MCF-7 cells transfected with Jagged-1–specific or scrambled (JAG1 and SCR, respectively) siRNA (1 μg, 72 hours’ pre-exposure). RT-PCR analysis of Jagged-1 mRNA, phase-contrast microscopy analysis, and MCF-7(S) size distribution. #P = 0.001, Monte Carlo χ2 test. (D) Day 7 secondary N-MS generated in the presence of IL-6 (10 ng/ml) and in the presence or absence of anti-N3 mAb, which blocks Notch-3 activity (1.5 μg/ml). Shown are phase-contrast microscopy and N-MS size distribution (n denotes number of spheroids counted per sample). ΧP = 0.039, **P = 0.009, Monte Carlo χ2 plus post-hoc tests adjusted for multiple comparisons. (E) RT-PCR analysis of Jagged-1 and Notch-3 mRNA (ratio to β2μ) in basal-like or ductal carcinoma tissues. ##P = 0.005, ΧΧP = 0.042, Mann-Whitney test. β2μ was assessed as quantitative control for RT-PCR; β-actin was assessed as quantitative control for Western blot. Scale bars: 100 μm.
Figure 5
Figure 5. IL-6/Notch-3 cross-talk promotes the upregulation of CA-IX mRNA and protein.
(A) RT-PCR analysis of CA-IX mRNA in day 10 primary N-MS cultured in the presence or absence of IL-6 (10 ng/ml) for 24 hours. (B) RT-PCR analysis of CA-IX mRNA and Western blot analysis of CA-IX (phosphorylated ERK, total ERK, and β-actin protein levels shown in Figure 4B) in MCF-7 cells exposed to IL-6 (10 ng/ml for 24 hours) in the presence or absence of UO-126 (20 μM) or DMSO, in shNotch-3 and control MCF-7 cells exposed to IL-6 (10 ng/ml for 24 hours), in MCF-7 cells transiently transfected with pNICD3/pEMPTY vector (1 μg), and in MCF-7 cells transfected with pNICD3 and coadministered with UO-126 (20 μM) or DMSO for 24 hours. (C) RT-PCR analysis of IL-6, Notch-3, and CA-IX mRNA in MCF-7 cells exposed to low oxygen (<0.1% O2) or 100 μM DFX and in N-MS and T-MS exposed to 50 μM DFX for 48 hours. (D) RT-PCR analysis of Notch-3 and CA-IX mRNA in MCF-7 cells in the presence or absence of anti–IL-6 (1.5 μg/ml) and in shNotch-3 and control-infected MCF-7 cells exposed to DFX (100 μM for 24 hours), Western blot analysis of Notch-3 and β-actin protein. β2μ was assessed as quantitative control for RT-PCR analysis.
Figure 6
Figure 6. The IL-6/Notch-3/CA-IX axis promotes hypoxia survival.
(A) MCF-7 cells in the presence or absence of DFX (100 μM for 48 hours) and in the presence or absence of anti–IL-6 (1.5 μg/ml for 24 hours), with transient transfection with the CA-IX–specific or scrambled siRNA (1 μg for 72 hours), and shNotch-3 and control MCF-7 cells. Shown are Western blot analysis of Notch-3 and β-actin protein and cell death analysis and RT-PCR analysis of Notch-3 and CA-IX mRNA (n = 3). *P = 0.017, **P = 0.008, ***P = 0.002, ANOVA. (B) Cell death analysis and RT-PCR analysis of Notch-3 and CA-IX mRNA in day 7 secondary T-MS exposed to 50 μM DFX for 48 hours in the presence or absence of anti–IL-6 (1.5 μg/ml for 48 hours) or anti-N3 (1.5 μg/ml for 48 hours) or transfected with CA-IX or scrambled siRNA (1 μg for 72 hours). n = 3 per group. #P = 0.022, ##P = 0.025, ###P = 0.044, ANOVA. (C) RT-PCR analysis and representative IHC analysis of CA-IX protein expression of breast carcinoma tissues from patients affected by basal-like or ductal breast carcinoma (see Table 2). Data are shown as CA-IX/β2μ mRNA ratio. ΧP = 0.002, Mann-Whitney test. β2μ was assessed as quantitative control for RT-PCR analysis. Scale bar: 100 μm.
Figure 7
Figure 7. IL-6/Notch-3 cross-talk enhances the invasive potential of MS and MCF-7 cells by means of CA-IX mRNA upregulation.
(A) Boyden invasion chamber assay in MCF-7 cells, in shNotch-3 and control MCF-7 cells, and in MCF-7 cells transiently transfected with scrambled or CA-IX siRNA (1 μg, 72 hours’ pre-exposure), in the presence or absence of IL-6 (10 ng/ml for 24 hours). n = 5 per group. *P = 0.0001, **P = 0.0001, #P = 0.0001, ANOVA. Inset: RT-PCR analysis of CA-IX mRNA in cells administered scrambled or CA-IX siRNA. (B) Boyden chamber invasion assay of day 7 secondary T-MS in the presence or absence of anti-IL6 (1.5 μg/ml for 24 h) or transfected with IL-6 or CA-IX or scrambled siRNA (1 μg, 72 hours’ pre-exposure). n = 3 per group. *P = 0.003, **P = 0.042, ΧP = 0.0001, ANOVA. RT-PCR analysis of IL-6 and CA-IX mRNA is shown. (C) Boyden chamber invasion assay of day 7 secondary N-MS exposed to IL-6 (10 ng/ml for 24 hours) in the presence or absence of anti-N3 (1.5 μg/ml for 24 hours) or scrambled or CA-IX siRNA (1 μg, 72 hours’ pre-exposure). n = 3 per group. #P = 0.036, ##P = 0.037, ΧP = 0.0001, ANOVA. RT-PCR analysis of IL-6, CA-IX, and β2μ mRNA is shown. (D) Zymographic analysis of MMP-2 activity in shNotch-3 and control MCF-7 cells in the presence or absence of IL-6 (10 ng/ml for 24 hours) and in MCF-7 cells exposed to IL-6 (10 ng/ml for 24 hours) transfected with CA-IX or scrambled siRNA (1 μg, 72 hours’ pre-exposure). n = 3 per group. *P = 0.032, #P = 0.025, ##P = 0.027, ANOVA.
Figure 8
Figure 8. Autocrine IL-6 loop sustains a CA-IX–dependent malignant phenotype in HYPO-7 cells.
(A) HYPO-7, a MCF-7–derived cell population, in the presence of IL-6 or scrambled siRNA (1 μg, 48 hours’ pre-exposure). RT-PCR analysis of IL-6, Notch-3, and CA-IX mRNA; cell death analysis in the presence of DFX (600 μM for 48 hours); and Boyden chamber invasion assay (n = 5) and zymographic analysis (n = 3) of MMP-2 activity (24 hours). *P = 0.042, **P = 0.0001, ***P = 0.015, ANOVA. (B) HYPO-7 cells in the presence of CA-IX or scrambled siRNA (1 μg, 48 hours’ pre-exposure). RT-PCR analysis of IL-6, Notch-3, and CA-IX mRNA; cell death analysis in the presence of DFX (600 μM for 48 hours); and Boyden chamber invasion assay (n = 5) and zymographic analysis (n = 3) of MMP-2 activity (24 hours). #P = 0.034, ##P = 0.0001, ###P = 0.018, ANOVA. (C) HYPO-7 cells, MCF-7(S), and T-MS exposed to anti–IL-6 (1.5 μg/ml) for 24 hours. RT-PCR analysis of IL-6 mRNA level. β2μ was assessed as quantitative control for RT-PCR analysis.
Figure 9
Figure 9. Autocrine IL-6 loop sustains a Notch-3/CA-IX–dependent aggressive phenotype in MCF-7 cells.
(A) RT-PCR analysis of IL-6 mRNA in MCF-7 cells and N-MS exposed to IL-6 (10 ng/ml) for 24 hours. (B) MCF-7 cells exposed to IL-6 (10 ng/ml for 24 hours) and assessed at various times (1 or 2 weeks) after the withdrawal of the cytokine. RT-PCR analysis of IL-6, Notch-3, and CA-IX mRNA and Boyden chamber invasion assay (n = 5) and zymographic analysis (n = 3) of MMP-2 activity (24 hours). *P = 0.010, #P = 0.012, ##P = 0.002, ANOVA with post-hoc test for multiple comparisons. (C) MCF-7 cells exposed to IL-6 (10 ng/ml) for 24 hours and assessed 2 weeks after cytokine withdrawal in the presence or absence of anti–IL-6 (1.5 μg/ml) for 24 hours. RT-PCR analysis of IL-6, Notch-3, and CA-IX mRNA and Boyden chamber invasion assay (24 hours). n = 5 per group. **P = 0.004, ANOVA with post-hoc test for multiple comparisons. (D) RT-PCR analysis of IL-6 and CA-IX mRNA, Western blot analysis of Notch-3 and β-actin protein level, and Boyden chamber invasion assay (24 hours) in shNotch-3 and control MCF-7 cells either untreated or exposed to IL-6 for 24 hours and assessed 2 weeks after cytokine withdrawal (n = 5). ΧP = 0.001, ANOVA with post-hoc test for multiple comparisons. (E) Boyden chamber invasion assay (24 hours) and RT-PCR analysis of CA-IX mRNA in cells as in C and D transfected with CA-IX or scrambled siRNA (1 μg, 48 hours’ pre-exposure). n = 5 per group. ΧΧP = 0.002, ANOVA. β2μ was assessed as quantitative control for RT-PCR analysis.

Comment in

Similar articles

Cited by

References

    1. Hodge D.R., Hurt E.M., Farrar W.L. The role of IL-6 and STAT3 in inflammation and cancer. Eur. J. Cancer. 2005;41:2502–2512. - PubMed
    1. Rose-John S., Scheller J., Elson G., Jones S.A. Interleukin-6 biology is coordinated by membrane-bound and soluble receptors:role in inflammation and cancer. J. Leukoc. Biol. 2006;80:227–236. - PubMed
    1. Knupfer H., Preiss R. Significance of interleukin-6 (IL-6) in breast cancer (review). Breast Cancer Res. Treat. 2007;102:129–135. - PubMed
    1. Bachelot T., et al. Prognostic value of serum levels of interleukin 6 and of serum and plasma levels of vascular endothelial growth factor in hormone-refractory metastatic breast cancer patients. Br. J. Cancer. 2003;88:1721–1726. - PMC - PubMed
    1. Zhang G.J., Adachi I. Serum interleukin-6 levels correlate to tumor progression and prognosis in metastatic breast carcinoma. Anticancer Res. 1999;19:1427–1432. - PubMed

Publication types

MeSH terms