. 2007 Aug;12(2):131-44.
doi: 10.1016/j.ccr.2007.07.003.

Promiscuous mutations activate the noncanonical NF-kappaB pathway in multiple myeloma

Affiliations

Promiscuous mutations activate the noncanonical NF-kappaB pathway in multiple myeloma

Jonathan J Keats et al. Cancer Cell. 2007 Aug.

Abstract

Activation of NF-kappaB has been noted in many tumor types, however only rarely has this been linked to an underlying genetic mutation. An integrated analysis of high-density oligonucleotide array CGH and gene expression profiling data from 155 multiple myeloma samples identified a promiscuous array of abnormalities contributing to the dysregulation of NF-kappaB in approximately 20% of patients. We report mutations in ten genes causing the inactivation of TRAF2, TRAF3, CYLD, cIAP1/cIAP2 and activation of NFKB1, NFKB2, CD40, LTBR, TACI, and NIK that result primarily in constitutive activation of the noncanonical NF-kappaB pathway, with the single most common abnormality being inactivation of TRAF3. These results highlight the critical importance of the NF-kappaB pathway in the pathogenesis of multiple myeloma.


Figures

Figure 1
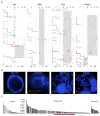
Figure 1. High Resolution aCGH Identifies Bi-Allelic Deletions of NFKB Regulatory Genes
A) The bi-allelic deletions (TRAF3, cIAP1 or cIAP2, CYLD, TRAF2) predicted to target NF-kB regulatory genes identified in our 62 MM patient and 46 HMCL aCGH cohorts are shown. All of the maps except the TRAF3 map, which is drawn to relative scale so that the exon structure can be shown, are drawn to scale. Black arrows above each gene represent the direction of transcription. For TRAF3 the direction of transcription follows the numerical exon order and light grey exon regions indicate coding region. Each bi-allelic deletion is shown below the respective genomic map. Solid grey bars indicate regions of bi-allelic deletion, solid grey lines indicated regions of bi-allelic deletion mapped by PCR, and dashed grey lines indicate the region containing the breakpoint. The position and the copy number prediction of the aCGH probes contain on the microarray are indicated by red (1 or more copies) or green (0 copies) dots. The position of probes used for cIg-FISH are shown below each genomic map. Dashed vertical red lines indicate the MDR identified by aCGH or PCR mapping. B) Representative images from the cIg-FISH validation of the aCGH findings are shown. Myeloma cells are identified by the blue cytoplasmic stain, which indicates the presence of either cytoplasmic kappa or lambda light chains. In the cIAP1/2 and TRAF2 panels a macrophage (kidney shaped nucleus) is shown that takes up the stain unspecifically. In the TRAF2 panel one of the three plasma cells shown still retains a copy of TRAF2, fitting the observed frequency of bi-allelic TRAF2 deletions observed in this patient sample.
Figure 2
Figure 2. NFKB Related Genes with spiked Expression correlate with genetic Abnormalities
A) Representative plots indicating the regional copy number abnormality and corresponding gene expression level are shown. The gene of interest is highlighted in red on each plot. The predicted number of gene copies is indicated on the top of each panel and the median normalized expression level is shown at the bottom. Each aCGH probe is represented by a dot and the color of each dot corresponds to the log2 ratio of the probe; black dots, normal copy number (log2 ratio -0.25-0.25); green dots (log2 ratio <-0.25); red dots (log2 ratio >0.25). The light grey region represents the mean copy number change identified by the CBS algorithm. Crosses indicate the gene expression probes for each gene and the log10 transformed expression levels are color coded to match the aCGH data. Pink circles highlight the expression probes corresponding to the gene of interest. B) Representative cIg-FISH images are shown that document the rearrangements of NIK and LTBR in MM patients, the duplication and insertion of CD40 into the Ig lambda locus, and the HSR containing TACI and NFKB1. C) Histogram plots of the NFKB index from normal PC, myeloma PC, and HMCL are shown and indicate the correlation between the NFKB index and the presence of an abnormality in the NF-kB pathways. The red bar below the index corresponds to the predicted transition point between processed versus unprocessed NFKB2. The red asterisks identify samples with questionable TRAF3 inactivation due to either a heterozygous mutation call by sequencing or a bi-allelic deletion in less than 25% of the plasma cells.
Figure 3
Figure 3. Sequencing identifies mutations in the coding region of TRAF3
A scale diagram of the TRAF3 polypeptide and the known protein domains identified by the SMART prediction tool are shown. Asterisks above the diagram note the position of the identified missense mutations (H70Y, R118W, Q430R, G462A, G480E, F490C) while the nonsense, frameshift and deletion mutations and the associated polypeptide effects are shown below as black bars. Black bars represent normal coding regions, grey lines indicate deleted regions, and thin bars represent the position of a frameshift and the length of translation before a stop codon is encountered. The thin grey bars indicated the translation of sequence originating within the TRAF3 locus while red bars indicate the translation of regions outside of the TRAF3 locus.
Figure 4
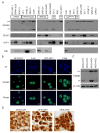
Figure 4. Mutations in the non-canonical NF-kB pathway correlate with processing of NFKB2 and the presence of NFKB2 in the nucleus
A) Immunoblots for the proteins of interest from the indicated HMCLs are shown. The three vertical panels are separated into a TRAF3, cIAP1, and NIK panel plus additional HMCL when possible. For the NFKB2, TRAF3, and NIK blots L363 and OPM-1 were included on the ends of each blot to serve as positive and negative controls and to ensure equivalent exposure between each panel. The cIAP1 blot for L363 has been taken from another gel as we had included KMS-18 as a negative control in all of the blot panels and this prevented L363 from being included. In all instances the bi-allelic deletion of TRAF3 or cIAP1 corresponds with the complete absence of a detectable protein product. B) The association between processing of NFKB2 and nuclear localization of NFKB2 was confirmed by immunofluorescence of HMCL without NFKB2 processing (OCI-MY5) compared to those with constitutive NFKB2 processing (L363, NIK overexpression; OCI-MY1, TRAF3 bi-allelic deletion; and U266, homozygous TRAF3 mutation). C) An NFKB2 immunoblot confirms the existence of NFKB2 processing in MM patient samples and shows a correlation between the processing ratio (left-right; positive, negative, positive, negative) and NFKB index (left-right; 1.07, 0.45, 1.26, 0.56). D) Immunohistochemistry of patients with a low (MCR-0459) or high (MCR-0687) NFKB index along with a patient with a TRAF3 bi-allelic deletion (MCR-0387) confirms the association between a high NFKB index or TRAF3 mutation and nuclear NFKB2. The images are representative of the 5 patient samples tested from each category. All core biopsies but one with sufficient plasma cells for scoring correlated with expectations of nuclear NFKB2 in TRAF3 mutants or samples with high NFKB index while samples with no know mutation and a low NFKB index had cytoplasmic NFKB2.
Figure 5
Figure 5. TRAF3 reintroduction inhibits NFKB2 processing and causes a growth arrest
The effects on HMCLs infected with an adenovirus expressing either EGFP and TRAF3WT or EGFP alone are shown A) Immunoblot showing the inhibition of p100 processing 48 hrs post infection. B) Effects of TRAF3WT expression on MTT defined cell growth. Infected cells were seeded 24 hrs post infection and the effects on cell growth we compared to control infections at 72 hrs and 96 hrs post-infection. Cells were seeded at specific densities to ensure that the cells infected with the EGFP expressing control virus remained in the exponential phase of the growth curve at both time measurements. Error bars represent the standard deviation C) Effect of TRAF3WT expression on the cell cycle status of selected HMCL 48 hrs post infection. The scale for each plot has been normalized for each HMCL. D) TRAF3WT reintroduction is associated with a significant increase in apoptosis as measured by Annexin-V staining.
Figure 6
Figure 6. Proposed Model Indicating the Effects of the Identified Abnormalities on the Non-Canonical NF-kB Pathway
The genes with inactivating abnormalities; TRAF2, TRAF3, cIAP1, cIAP2, and CYLD, are indicated by green objects while the genes with activating abnormalities; LTBR, TACI, CD40, NIK, and NFKB2, are indicated by red objects. Based on our observations and those from other groups we propose the existence of a cytoplasmic NIK regulatory complex, shown in the light red hexagon, that is dependent on TRAF2, TRAF3, cIAP1 and/or cIAP2.

Similar articles

Cited by

References

    1. Annunziata CM, Davis R, Gabrea A, Kuehl M, Staudt LM. NF-kappaB-inducing kinase activates NF-kappaB signaling in multiple myeloma. Proc Amer Assoc Cancer Res. 2006;47 [Abstract #LB-124]
    1. Barrett MT, Scheffer A, Ben-Dor A, Sampas N, Lipson D, Kincaid R, Tsang P, Curry B, Baird K, Meltzer PS, et al. Comparative genomic hybridization using oligonucleotide microarrays and total genomic DNA. Proc Natl Acad Sci U S A. 2004;101:17765–17770. - PMC - PubMed
    1. Bergsagel PL, Chesi M, Nardini E, Brents LA, Kirby SL, Kuehl WM. Promiscuous translocations into immunoglobulin heavy chain switch regions in multiple myeloma. Proc Natl Acad Sci U S A. 1996;93:13931–13936. - PMC - PubMed
    1. Bergsagel PL, Kuehl WM, Zhan F, Sawyer J, Barlogie B, Shaughnessy J., Jr Cyclin D dysregulation: an early and unifying pathogenic event in multiple myeloma. Blood. 2005;106:296–303. - PMC - PubMed
    1. Caamano JH, Rizzo CA, Durham SK, Barton DS, Raventos-Suarez C, Snapper CM, Bravo R. Nuclear factor (NF)-kappa B2 (p100/p52) is required for normal splenic microarchitecture and B cell-mediated immune responses. J Exp Med. 1998;187:185–196. - PMC - PubMed

Publication types

MeSH terms

Substances