. 2007 Jul;13(7):828-35.
doi: 10.1038/nm1609. Epub 2007 Jul 1.

Altered recognition of antigen is a mechanism of CD8+ T cell tolerance in cancer

Affiliations

Altered recognition of antigen is a mechanism of CD8+ T cell tolerance in cancer

Srinivas Nagaraj et al. Nat Med. 2007 Jul.

Abstract

Antigen-specific CD8+ T-cell tolerance, induced by myeloid-derived suppressor cells (MDSCs), is one of the main mechanisms of tumor escape. Using in vivo models, we show here that MDSCs directly disrupt the binding of specific peptide-major histocompatibility complex (pMHC) dimers to CD8-expressing T cells through nitration of tyrosines in a T-cell receptor (TCR)-CD8 complex. This process makes CD8-expressing T cells unable to bind pMHC and to respond to the specific peptide, although they retain their ability to respond to nonspecific stimulation. Nitration of TCR-CD8 is induced by MDSCs through hyperproduction of reactive oxygen species and peroxynitrite during direct cell-cell contact. Molecular modeling suggests specific sites of nitration that might affect the conformational flexibility of TCR-CD8 and its interaction with pMHC. These data identify a previously unknown mechanism of T-cell tolerance in cancer that is also pertinent to many pathological conditions associated with accumulation of MDSCs.


Figures

Figure 1
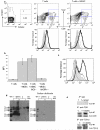
Figure 1. MSDC disrupt binding of pMHC to CD8+ T cells
(a) OT-1 T cells (CD45.1) were transferred to naïve congenic (CD45.1+) recipients. Adoptive transfer of MDSC and immunization were performed as described in Methods. LN cells were collected 10 days later and were gated for donor's CD45.1 CD8+ T cells. T cells alone – no MDSC transfer was performed. Typical example of 8 performed experiments is shown. (b) CD45.1 CD8+ OT-1 T cells were incubated with various amount of PE-conjugated MHC-Ig (1.20 × 10⁻⁶ to 6.25 × 10⁻⁸ M). Binding was determined by flow cytometry. MCF-mean channel fluorescence. The level of fluorescence of non-specific dimer (SIYRYYGL-Kb-Ig) was subtracted from the values of fluorescence obtained with specific dimer (SIINFEKL- Kb-Ig). T – T cells from control mice T+MDSC- T cells from mice which received OT-1-T cells + MDSC. Three experiments with similar results were performed. (c) The expression of CD8 and Vα2 TCR from OT-1 mice was evaluated in antigen specific CD45.1 CD8+ T cells from control and tolerized mice. The mean fluorescence ± st. dev. from three different experiments are shown. (d) Adoptive transfer of OT-1 cells, MDSC and immunization were performed as described above. Ten days later LN cells were restimulated in triplicates for 48 h with specific or control peptides at indicated concentrations. IFN-γ producing cells was scored in ELISPOT assay and calculated per 2×10⁵ LN cells. Three experiments with the same results were performed. CP – re-stimulation with control peptide, SP- re-stimulation with specific peptide (SIINFEKL). Naïve – no adoptive transfer of OT-1 T cells was performed; T-cells – adoptive transfer of OT-1 T cells but no MDSC; T cells + MDSC − adoptive transfer of both OT-1 T cells and MDSC. (e) Experimental design was as described above. Additional immunization was performed on day 8. Splenocytes were isolated on day 10 and tested in a standard 6 h 51Cr-release CTL assay against the target EL-4 cells loaded with specific or control peptides at indicated concentrations. Cells were incubated in duplicates at 25:1 effector : target ratio. The levels of non-specific cytotoxicity (EL-4 target cells loaded with control peptide) were subtracted. Background cytotoxicity was less than 10%. Two experiments with similar results were performed. (f) 2C T cells were transferred to naïve recipients followed by transfer of MDSC and immunization as described above and in Fig. S1. The following peptides were used for immunization: SIYRYYGL (SIY), LSPFPFDL (P2CA), and EQYKFYSV (DEV8). CP – control peptide (SIINFEKL). LN cells were collected 10 days later and were re-stimulated with corresponding peptides in an IFN-γ ELISPOT assay. Each group included three mice.
Figure 2
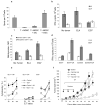
Figure 2. Mechanism of MDSC induced T-cell tolerance
Experimental design with adoptive transfer and immunization was as described in Fig 1. (a–c) IFN-γ ELISPOT assay of LN cells re-stimulated with control (CP) or specific (SP) peptides was performed. Results presented as Average ± SD per 2×10⁵ LN cells. * - significant differences (p<0.05) between CP and SP groups. (a) MDSC from EL-4 tumor-bearing NADPH−/− (gp91phox−/−) or wild-type mice were used for adoptive transfer. Mean ± st. dev. from three performed experiments are shown (b) Mice were treated with UA in suspension (20 mg in 100 μl) on days -1, 0, 1, and 2 after MDSC transfer. (c) MDSC from EL-4 tumor-bearing iNOS−/− mice were used for adoptive transfer. Two experiments with the same results were performed. (d) LN cells from OT-1 mice were cultured with 10 μg/ml SIINFEKL and MDSC (at 3:1 ratio) for 48 h in the presence of 1 mg/ml urea. After that time the binding of control and specific pMHC to CD8+ T cells was evaluated using flow cytometry as described in Fig. 1. T – T cells incubated without MDSC; T+MDSC- T cells incubated with MDSC; T + MDSC+Urea − T cells incubated with MDSC in the presence of urea.
Figure 3
Figure 3. Effect of peroxynitrite donor on specific CD8+ T-cell activity
(a) OT-1 T cells were pretreated with SIN-1 (0 to10 mM) for 30 min and then 5×10⁴ T cells were cultured for 4 days with DCs at a 10:1 ratio. CP – DCs were loaded with 10 μg/ml control (RAHYNIVTF) peptide, SP – DCs were loaded with 10 μg/ml specific (SIINFEKL) peptide. PHA – OT-1 T cells and DCs were cultured for 3 days in the presence of 1 μg/ml PHA. 3[H]-thymidine (1 μCi/well) was added 18 h prior to cell harvest and radioactivity was measured in triplicates in liquid scintillation counter. Results presented as Mean ± SD. (b) OT-1 T cells were cultured for 48 h with DCs, peptide and PHA as described in Fig. 3a. The number of IFN-γ producing cells was evaluated in quadruplicates in ELISPOT assay. Results presented as Mean ± SD. (c) OT-1 T cells were pretreated with 1 mM SIN-1 for 30 min. The binding of control and specific pMHC dimers to CD8+ T cells was evaluated using flow cytometry as described in Fig. 1. T – T cells stimulated with specific peptide-loaded DCs; T+Sin-1 – T cells pre-treated with SIN-1. (d) Cells were treated as described in Fig. 3c and then labeled with anti-CD8 or anti-TCRαβ antibodies. The levels of expression (mean fluorescence intensity, MFI) within the population of CD8+ T cells were evaluated by flow cytometry. The results of three experiments are shown.
Figure 4
Figure 4. Role of MDSC in the nitration of tyrosine in a CD8+ T cell
(a) Adoptive transfer and immunization was performed as described in Figs 1 and S1. Eight days later LNs were isolated and labeled with anti-CD8, anti-Vα2, and anti-NT antibodies. The level of NT expression was evaluated within population of donors (CD8+Vα2+) (bold line) and recipient (CD8+Vα2) (thin line). Shaded areas show staining with isotype control IgG. (b) Splenocytes from OT-1 mice were cultured with control or specific peptides for 72 h in the presence of MDSC (at 3:1 ratio) from wild-type, NADPH−/−(gp91phox−/−) and iNOS−/− EL-4 tumor-bearing mice. After that time cells were collected and the levels of NT in CD8+ T cells were evaluated by flow cytometry. Mean ± SD of MFI from three experiments are shown. Not shown MFI for samples with control peptides, which were below 30 in all experiments. (c) The level of NT in CD8+ OT-1 T cells. Cells were treated as described in Fig. 4b. Shaded area − splenocytes alone, bold line splenocytes + MDSC; dashed line 1 mM SOD was added; thin line − 1 mM L-NMMA was added. CD8+ cells were gated and NT expression was measured within this cell population. Not shown MFI for samples with control peptides, which were below 30 in all experiments. (d) Splenocytes from OT-1 mice were cultured for 48 h with specific peptide in the presence of MDSC (at 3:1 ratio). Whole cell lysates were prepared and were subjected to 10%SDS-PAGE electrophoresis and probed with anti-NT antibody. Nitrated BSA was used as a positive control for NT staining. Bands were visualized using ECL. Chemical reduction of nitrotyrosine was done using sodium dithionite. The membrane was washed and probed with anti-NT antibody. Each experiment was performed in duplicates (shown). (e) Splenocytes cells from OT-1 mice were treated as described above. Whole cell lysates were prepared and CD8 and TCRβ were immunoprecipitated using specific antibodies as described in Methods. Rabbit IgG was used in control experiments. The proteins were subjected to 10%SDS-PAGE electrophoresis and probed with anti-NT antibody. To verify loading, the same blots were stripped and re-probed with anti-CD8 or anti-TCRβ antibodies.
Figure 5
Figure 5. Interaction between MDSC and CD8+ T cells.
(a–d) Splenocytes from OT-1 mice were cultured with specific peptide and MDSC (at 3:1 ratio). The cells were labeled with anti-Gr-1-PE (red), anti-CD8-Alexa 647 (magenta), anti-NT-Alexa 488 (green), or isotype-Alexa 488 (green) at different time points and visualized under a confocal microscopy. Scale bar = 10 μm. (a) MDSC and CD8 T cells separate; (b–c) 5 h co-culture. Arrows denote positive staining for NT localized at contacts between MDSC and CD8+ T cells. (d) 48 h culture. (e) LN from individuals with breast and head and neck cancers were collected during tumor resection as part of routine pathological examination. LNs without presence of tumor were further evaluated (see Fig. S5). The number of NT positive cells per 103 CD8+ T cells are shown.
Figure 6
Figure 6. MDSC induced CD8+ T-cell tolerance in tumor-bearing mice
(a) Mice were treated as described in Fig. S1. Ten days after immunization LN cells were re-stimulated in triplicates with control or specific peptide or with bone marrow derived immature (iDC) or LPS activated matured (mDC) DCs. DCs were added at 1:10 ratio. The number of IFN-γ producing cells was measured in ELISPOT assay. Mean ± st. dev. from two experiments are shown. The values of stimulation with control peptide were subtracted from the values of stimulation with specific peptide. (b–e). C57BL/6 mice were inoculated subcutaneously with 5×10⁵ of EL-4 or EG-7 tumor cells. Seven days after inoculation each mouse had been injected intravenously with 5×10⁶ OT-1 T-cells. Seven days later mice were sacrificed and LN cells used in further experiments. (b) LN cells were stimulated with specific (SP) (SIINFEKL) or control (CP) (RAHYNIVTF) peptides and analyzed in IFN-γ ELISPOT assay. The number of spots were calculated per 105 LN cells. Each group included 3 mice. The differences between SP and CP were statistically significant (p<0.05) from control and EL-4 tumor-bearing mice. (c) Splenocytes were labeled with anti-CD8, anti-Vα2' and anti-nitrotyrosine antibodies. The level of NT expression was evaluated within the populations of donors (CD8+Vα2+) and recipient (CD8+Vα2) cells. MFI-mean fluorescence intensity. Results of the two performed experiments are shown. The differences between NT levels in donor's cells from EG-7 mice and EL-4 or control mice were statistically significant. (d) EG-7 tumor-bearing mice were treated with daily i.p. injections of UA (20 mg/100 μl PBS) starting from the day of T-cell transfer. LN cells were collected 7 days later and analyzed in IFN-γ ELISPOT assay as described in Fig. 6b. (e) Splenocytes from EG-7 tumor-bearing mice described above were stimulated ex vivo for 7 days with SIINFEKL peptide 10 μg/ml, in the presence of IL-15 (10 ng/ml) and IL-21 (10 ng/ml) and used as effectors in a standard 6-h 51Cr-release CTL assay. Target cells were EL-4 cells pulsed with 10 μg/ml of either specific (SIINFEKL) or control (RAHYNIVTF) peptides. In addition, EG7 cells were also used as targets. Different effector:target cell ratios were used. Each experiment was performed in duplicates and included three mice per group. Mean ± st. dev. are shown. (f) MC38 tumor was established in C57BL/6 mice by subcutaneous injection of 2×10⁵ tumor cells. On day 10 after tumor inoculation when tumors became palpable mice were split into four groups with equal tumor size. Each group included 5-6 mice. Mice in treatment group (vaccine + UA) were injected s.c with 5×10⁵ DCs infected recombinant adenovirus containing mouse wild-type p53 gene as previously described. Immunizations were repeated twice with 5-6 day interval. Treatment with UA (20 mg/100 μl PBS) was started three days after the first immunization and was continued for two weeks. Control groups included mice treated with UA alone (UA only), vaccine alone (vaccine only), or untreated (control). Tumor size was measured using calipers and presented as the result of multiplication of two longest dimensions. Mean ± st. dev. are shown.

Similar articles

Cited by

References

    1. Pardoll D. Does the immune system see tumors as foreign or self? Annu. Rev. Immunol. 2003;21:807–839. - PubMed
    1. Sotomayor EM, et al. Conversion of tumor-specific CD4+ T-cell tolerance to T-cell priming through in vivo ligation of CD40. Nat. Med. 1999;5:780–787. - PubMed
    1. Cuenca A, et al. Extra-lymphatic solid tumor growth is not immunologically ignored and results in early induction of antigen-specific T-cell anergy: dominant role of cross-tolerance to tumor antigens. Cancer. Res. 2003;63:9007–9015. - PubMed
    1. Kusmartsev S, Nagaraj S, Gabrilovich DI. Tumor-associated CD8+ T cell tolerance induced by bone marrow-derived immature myeloid cells. J. Immunol. 2005;175:4583–4592. - PMC - PubMed
    1. Huang B, et al. Gr-1+CD115+ immature myeloid suppressor cells mediate the development of tumor-induced T regulatory cells and T-cell anergy in tumor-bearing host. Cancer. Res. 2006;66:1123–1131. - PubMed

Publication types