. 2007 Jul;13(7):998-1016.
doi: 10.1261/rna.502507. Epub 2007 May 18.

The decapping activator Lsm1p-7p-Pat1p complex has the intrinsic ability to distinguish between oligoadenylated and polyadenylated RNAs

Affiliations

The decapping activator Lsm1p-7p-Pat1p complex has the intrinsic ability to distinguish between oligoadenylated and polyadenylated RNAs

Ashis Chowdhury et al. RNA. 2007 Jul.

Abstract

Decapping is a critical step in mRNA decay. In the 5'-to-3' mRNA decay pathway conserved in all eukaryotes, decay is initiated by poly(A) shortening, and oligoadenylated mRNAs (but not polyadenylated mRNAs) are selectively decapped allowing their subsequent degradation by 5' to 3' exonucleolysis. The highly conserved heptameric Lsm1p-7p complex (made up of the seven Sm-like proteins, Lsm1p-Lsm7p) and its interacting partner Pat1p activate decapping by an unknown mechanism and localize with other decapping factors to the P-bodies in the cytoplasm. The Lsm1p-7p-Pat1p complex also protects the 3'-ends of mRNAs in vivo from trimming, presumably by binding to the 3'-ends. In order to determine the intrinsic RNA-binding properties of this complex, we have purified it from yeast and carried out in vitro analyses. Our studies revealed that it directly binds RNA at/near the 3'-end. Importantly, it possesses the intrinsic ability to distinguish between oligoadenylated and polyadenylated RNAs such that the former are bound with much higher affinity than the latter. These results indicate that the intrinsic RNA-binding characteristics of this complex form a critical determinant of its in vivo interactions and functions.


Figures

FIGURE 1.
FIGURE 1.
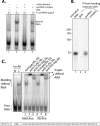
Purification of the Lsm1p-7p–Pat1p complex. (A) mRNA decay and mRNA 3′-end protection functions are normal in the FLAG-LSM1, LSM5–6xHis strain used for purification. RNA made from exponentially growing cultures of wild-type strain lacking epitope tags (yRP841, lane 3), the FLAG-LSM1, LSM5–6xHis strain (yST254, lane 2), and the lsm1Δ strain (yST247, lane 1) were subjected to Northern analysis for MFA2pG mRNA as described in Materials and Methods. The positions of the full-length MFA2pG mRNA and the poly(G) decay intermediate are indicated on the right. (Arrow on left) The position of the oligoadenylated full-length mRNA that accumulates in lsm1Δ cells due to block in decapping. (Upper and lower asterisks on the left) The positions of the 3′-trimmed forms of the full-length MFA2pG mRNA and the poly(G) decay intermediate, respectively, observed in lsm1Δ cells. The % poly(G) fragment was calculated by taking the sum of the signal from the full-length species (trimmed and normal) and poly(G) fragment (trimmed and normal) as 100%. (B) The purified Lsm1p-7p–Pat1p complex preparation contains the seven Lsm proteins and Pat1p. Lysate prepared from the FLAG-LSM1, LSM5–6xHis strain (lanes 5–8) or a control strain lacking the 6×His tag (lanes 1–4) was subjected to purification using anti-Flag antibody matrix followed by Ni-NTA matrix as described in Materials and Methods. The proteins present in the sample at different stages of purification (indicated on top) were revealed by SDS-PAGE analysis followed by silver staining. (Left) Positions of size markers. (Right) Identities of the bands observed with the final purified material obtained from the FLAG-LSM1, LSM5–6xHis strain (lane 8) as determined by mass spectrometry analysis of the corresponding gel slices. (Asterisks on the right) Pat1p bands of higher-than-expected mobility (see text).
FIGURE 2.
FIGURE 2.
Purified Lsm1p-7p–Pat1p complex is capable of binding RNA. (A) Incubation of RNA with purified Lsm1p-7p–Pat1p complex results in gel mobility shift of the RNA. RNA-binding reactions containing MFA2(u) RNA (radiolabeled at U-residues) were carried out as described in Materials and Methods with the purified complex (at a final concentration of 40.6 nM; lanes 2–4) or BSA (lane 1) in the presence of E. coli tRNA at a final concentration of 0.1 μg/μL (lanes 1–3) or 1.0 μg/μL (lane 4) and in the presence (lane 3) or absence (lanes 1,2,4) of cold MFA2(u) RNA [used at eightfold molar excess over the hot MFA2(u) RNA]. Following incubation, samples were separated on a native polyacrylamide gel and visualized by Phosphorimaging as described in Materials and Methods. (Bottom) The nucleotide sequence of the RNA substrate. (B) Pull-down of the Lsm1p-7p–Pat1p complex from the RNA-binding reaction coprecipitates the RNA. RNA-binding reactions were carried out as described in Materials and Methods using radiolabeled MFA2(u) RNA and the purified complex (at a final concentration of 40.6 nM; lane 3) or BSA (lane 2). The reaction mix was then incubated with anti-Flag antibody matrix, and the RNA bound to the matrix was extracted and visualized by denaturing polyacrylamide gel electrophoresis and PhosphorImaging as described in Materials and Methods. (Lane 1) Untreated MFA2(u) RNA. (Left) Positions of size markers. About 59% of the input RNA was coprecipitated with the Lsm1p-7p–Pat1p complex in this experiment. (C) RNPs formed in the presence of the purified Lsm1p-7p–Pat1p complex can be supershifted using antibodies directed against the Lsm proteins. RNA-binding reactions were carried out as described in Materials and Methods using radiolabeled MFA2(u) RNA and the purified complex (at a final concentration of 40.6 nM), following which anti-Flag (lane 2), anti-His tag (lane 3), or nonspecific antibody (lane 1) was added to the reaction mix, and incubation was continued as described in Materials and Methods. The samples were finally visualized by native polyacrylamide gel electrophoresis and Phosphorimaging as described in Materials and Methods. (Lanes 4–6) Similar experiments (indicated on top of the lanes) in which the purified complex was incubated with the antibody before adding the RNA. (Left) Binding reactions carried out using the purified complex or BSA (labeled L and B, respectively, on top) in the absence of any antibody.
FIGURE 3.
FIGURE 3.
Lsm1p-7p–Pat1p complex makes direct contacts with RNA. (A) Proteins present in the purified Lsm1p-7p–Pat1p complex can be UV cross-linked to RNA. RNA-binding reactions containing MFA2(u) RNA (radiolabeled at U-residues) were carried out as described in Materials and Methods with the purified complex (at a final concentration of 40.6 nM; lanes 1–5) or BSA (lane 6) in the presence (lane 5) or absence (lanes 1–4 and 6) of cold MFA2(u) RNA [used at eightfold molar excess over the hot MFA2(u) RNA]. Aliquots of the reaction mix were then exposed to UV irradiation for varying lengths of time (indicated above the lanes) followed by ribonuclease treatment, SDS-PAGE separation, and Phosphorimaging as described in Materials and Methods. (Left) Positions of size markers. (Right) Expected positions of the Lsm proteins. (B) The 23-kDa band that gets UV cross-linked to RNA contains Flag-Lsm1p. Purified Lsm1p-7p–Pat1p complex was bound to radiolabeled MFA2(u) RNA and exposed to UV for 0 (lane 2) or 30 min (lanes 1,3). After ribonuclease treatment, the samples were treated with detergent (to disrupt the protein complexes) and then immunoprecipitated with either anti-Flag antibody matrix (lanes 1,2) or anti-HA antibody matrix (lane 3) before separation of the proteins pulled down by SDS-PAGE and their visualization by Phosphorimaging. (Left) Positions of molecular weight markers.
FIGURE 4.
FIGURE 4.
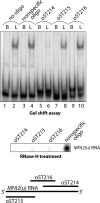
Lsm1p-7p–Pat1p complex binds near the 3′-end of RNA. Radiolabeled MFA2(u) RNA was annealed to DNA oligonucleotides oST214, oST215, oST216, a nonspecific DNA oligonucleotide, or no oligonucleotide (indicated above the lanes in upper and middle panels). The annealed RNA was then subjected either to RNA-binding reactions with the purified complex (at a final concentration of 40.6 nM; lanes labeled with L on top) or BSA (lanes labeled with B on top), followed by visualization of gel-shifted RNA as described in Materials and Methods (upper panel) or RNase-H treatment followed by separation on denaturing gels and autoradiography (middle panel). (Lower panel) Regions of MFA2(u) RNA spanned by the oligonucleotides oST214, oST215, and oST216 are shown schematically.
FIGURE 5.
FIGURE 5.
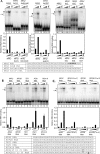
Presence of a stretch of U-residues near the 3′-end of the RNA facilitates the Lsm1p-7p–Pat1p complex binding. (A) Mutation, deletion, or relocation of the 6×U-stretch near the 3′-end of the MFA2 RNA impairs Lsm1p-7p–Pat1p complex binding. (B) RNA substrates that carry an uninterrupted stretch of six or more U-residues near their 3′-ends bind to the Lsm1p-7p–Pat1p complex better than RNAs that do not. (C) A single U-to-C change within the U-stretch could significantly affect binding. (Top panels) RNA-binding reactions were carried out as described in Materials and Methods using various radiolabeled RNAs (indicated above the lanes) in the presence of the purified Lsm1p-7p–Pat1p complex at a final concentration of 2.8 nM (lanes 1,5,9,13 in C), 8.12 nM (lanes 16,19,22,25 in A; lanes 1,4,7,10,13 in A,B), 14 nM (lanes 2,6,10,14 in C), 40.6 nM (lanes 17,20,23,26 in A; lanes 2,5,8,11,14 in A,B), or 56 nM (lanes 3,7,11,15 in C) or in the presence of BSA (lanes labeled with B on top). After the reaction, gel shift of the RNA was visualized as described in Materials and Methods. (*) Position of gel-shifted RNA. (Arrow on the left of the gel) The smear observed below the band of gel-shifted RNA resulting from destabilization of the RNPs during the gel run. (Middle panels) Fraction of the RNA bound in each reaction (quantitated from the gel using a PhosphorImager) normalized to the value obtained with MFA2 RNA at 40.6 nM (in A,B) or 56 nM (in C) concentration of the purified complex is shown as a bar diagram directly under the corresponding lane of the gel picture. (Bottom panels) Sequences of the various RNA substrates used for the gel shift assays. The 6×U-stretch of MFA2 RNA, which is replaced with 6×A or 6×C or 6×G in MFA2 6×A, MFA2 6×C and MFA2 6×G RNAs, respectively, is shown in bold. The U-to-C and C-to-U changes introduced in MFA2 (U-to-C) RNA and RPP2B (C-to-U) RNA are underlined.
FIGURE 6.
FIGURE 6.
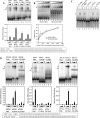
Lsm1p-7p–Pat1p complex has a higher affinity for oligoadenylated RNA than polyadenylated RNA. (A) Lengthening the oligoadenylate tail of the MFA2 RNA leads to a progressive weakening of Lsm1p-7p–Pat1p complex binding. (Upper panel) RNA-binding reactions were carried out as described in Materials and Methods using various radiolabeled RNAs (indicated above the lanes) in the presence of the purified Lsm1p-7p–Pat1p complex at a final concentration of 8.12 nM (lanes 1,4,7,10) or 40.6 nM (lanes 2,5,8,11) or in the presence of BSA (lanes labeled with B on top). After the reaction, gel shift of the RNA was visualized as described in Materials and Methods. (Lower panel) Fraction of the RNA bound in each reaction (quantitated from the gel using a PhosphorImager) normalized to the value obtained with MFA2 RNA at 40.6 nM concentration of the purified complex is shown as a bar diagram directly under the corresponding lane of the gel picture. (B) MFA2(u) RNA carrying a 55-residue-long 3′-poly(A) tail [MFA2(u)A55 RNA] binds to the Lsm1p-7p–Pat1p complex with an affinity similar to that of the MFA2(u) RNA. (Upper panel) RNA-binding reactions were carried out as described in Materials and Methods using the radiolabeled RNAs indicated below the lanes in the presence of the purified Lsm1p-7p–Pat1p complex at a final concentration of 4.06 nM (lanes 1,7), 8.12 nM (lanes 2,8), 20.3 nM (lanes 3,9), 40.6 nM (lanes 4,10), 81.2 nM (lanes 5,11), or 203 nM (lanes 6,12). After the reaction, gel shift of the RNA was visualized as described in Materials and Methods. (Lower panel) Percentage of RNA bound (quantitated from the gel using a PhosphorImager) is plotted against the concentration of the Lsm1p-7p–Pat1p complex used in the reaction. Both MFA2(u) and MFA2(u)A55 RNAs bound to the purified complex with an apparent K D of ∼200 nM. Sequences of MFA2 and MFA2(u) RNA substrates used in the experiments are shown at the bottom of A and B. (C) The binding site of the Lsm1p-7p–Pat1p complex is the same in both MFA2(u) and MFA2(u)A55 RNAs. Experiments were carried out as described for Figure 4 except that MFA2(u)A55 RNA was used as the substrate in the RNA-binding reactions. (D) The 3′-tail length effect (on the binding of the Lsm1p-7p–Pat1p complex) is specific for oligo(A) tail (middle panel) and is also observed with RPP2B RNA (left panel), and TEF1(s) RNA (right panel) as with the MFA2 RNA. (Upper panels) RNA-binding reactions (using various radiolabeled RNA substrates indicated above the lanes) and visualization of results were carried out as described in A. Reactions carried out with purified Lsm1p-7p–Pat1p complex at a final concentration of 8.12 nM (lanes 1,4,7) or 40.6 nM (lanes 2,5,8) or in the presence of BSA (lanes labeled with B on top) are shown. (Lower panels) Fraction of the RNA bound in each reaction (quantitated from the gel using a PhosphorImager) normalized to the value obtained with RNA lacking a 3′-tail (at 40.6 nM concentration of the purified complex) in each set is shown as a bar diagram directly under the corresponding lane of the gel picture. Sequences of the TEF1(s) and RPP2B RNAs are shown at the bottom. (E) Influence of the 3′-oligoadenylate tail length on the binding of the Lsm1p-7p–Pat1p complex to the RNA is not directly related to the U-rich sequence near the 3′-end of the body of the RNA. Binding reactions were carried out and results were visualized as described for D. The upper and lower panels are presented as in D except that in the case of comparison of MFA2-A5 and MFA2-6xU(5′)-A5 RNAs, the RNA binding quantitated after the gel shift assays is shown as a percentage of RNA bound in each reaction (without normalization) in the bar diagram. Sequences of the relevant RNA substrates are shown at the bottom. (F) The difference in the binding affinity for the Lsm1p-7p–Pat1p complex of RNAs that bear or lack an uninterrupted stretch of Us near their 3′-ends disappears when they are oligoadenylated. The binding reactions were carried out and results were visualized as described for D. The upper and lower panels are presented as in D except that the bar diagram in the lower panel shows the percentage of RNA bound in each reaction without normalization. (Bottom) Sequences of the RNA substrates used for gel shifts. (G) Binding of the Lsm1p-7p–Pat1p complex to the oligoadenylated RNA cannot be competitively inhibited by oligo(A). (Upper panel) RNA-binding reactions were carried out as described in Materials and Methods using radiolabeled MFA2 RNA (lanes 1–5) or MFA2-A5 RNA (lanes 6–10) with the purified Lsm1p-7p–Pat1p complex (at a final concentration of 20.3 nM) that had been preincubated for 10 min at 30°C (before adding the radiolabeled RNA) in the presence of varying folds of molar excess (over the radiolabeled RNA) of oligo(A) (indicated above the lanes). After the reaction, gel shift of the RNA was visualized as described in Materials and Methods. (Lower panel) The percentage of the RNA bound in each reaction (quantitated from the gel using a PhosphorImager) is shown as a bar diagram directly under the corresponding lane of the gel picture. (* on the left in each figure) Positions of gel-shifted RNAs. (A,D,E,F, arrow on left) The smear observed below the band of gel-shifted RNA resulting from destabilization of the RNPs during the gel run.
FIGURE 6.
FIGURE 6.
Lsm1p-7p–Pat1p complex has a higher affinity for oligoadenylated RNA than polyadenylated RNA. (A) Lengthening the oligoadenylate tail of the MFA2 RNA leads to a progressive weakening of Lsm1p-7p–Pat1p complex binding. (Upper panel) RNA-binding reactions were carried out as described in Materials and Methods using various radiolabeled RNAs (indicated above the lanes) in the presence of the purified Lsm1p-7p–Pat1p complex at a final concentration of 8.12 nM (lanes 1,4,7,10) or 40.6 nM (lanes 2,5,8,11) or in the presence of BSA (lanes labeled with B on top). After the reaction, gel shift of the RNA was visualized as described in Materials and Methods. (Lower panel) Fraction of the RNA bound in each reaction (quantitated from the gel using a PhosphorImager) normalized to the value obtained with MFA2 RNA at 40.6 nM concentration of the purified complex is shown as a bar diagram directly under the corresponding lane of the gel picture. (B) MFA2(u) RNA carrying a 55-residue-long 3′-poly(A) tail [MFA2(u)A55 RNA] binds to the Lsm1p-7p–Pat1p complex with an affinity similar to that of the MFA2(u) RNA. (Upper panel) RNA-binding reactions were carried out as described in Materials and Methods using the radiolabeled RNAs indicated below the lanes in the presence of the purified Lsm1p-7p–Pat1p complex at a final concentration of 4.06 nM (lanes 1,7), 8.12 nM (lanes 2,8), 20.3 nM (lanes 3,9), 40.6 nM (lanes 4,10), 81.2 nM (lanes 5,11), or 203 nM (lanes 6,12). After the reaction, gel shift of the RNA was visualized as described in Materials and Methods. (Lower panel) Percentage of RNA bound (quantitated from the gel using a PhosphorImager) is plotted against the concentration of the Lsm1p-7p–Pat1p complex used in the reaction. Both MFA2(u) and MFA2(u)A55 RNAs bound to the purified complex with an apparent K D of ∼200 nM. Sequences of MFA2 and MFA2(u) RNA substrates used in the experiments are shown at the bottom of A and B. (C) The binding site of the Lsm1p-7p–Pat1p complex is the same in both MFA2(u) and MFA2(u)A55 RNAs. Experiments were carried out as described for Figure 4 except that MFA2(u)A55 RNA was used as the substrate in the RNA-binding reactions. (D) The 3′-tail length effect (on the binding of the Lsm1p-7p–Pat1p complex) is specific for oligo(A) tail (middle panel) and is also observed with RPP2B RNA (left panel), and TEF1(s) RNA (right panel) as with the MFA2 RNA. (Upper panels) RNA-binding reactions (using various radiolabeled RNA substrates indicated above the lanes) and visualization of results were carried out as described in A. Reactions carried out with purified Lsm1p-7p–Pat1p complex at a final concentration of 8.12 nM (lanes 1,4,7) or 40.6 nM (lanes 2,5,8) or in the presence of BSA (lanes labeled with B on top) are shown. (Lower panels) Fraction of the RNA bound in each reaction (quantitated from the gel using a PhosphorImager) normalized to the value obtained with RNA lacking a 3′-tail (at 40.6 nM concentration of the purified complex) in each set is shown as a bar diagram directly under the corresponding lane of the gel picture. Sequences of the TEF1(s) and RPP2B RNAs are shown at the bottom. (E) Influence of the 3′-oligoadenylate tail length on the binding of the Lsm1p-7p–Pat1p complex to the RNA is not directly related to the U-rich sequence near the 3′-end of the body of the RNA. Binding reactions were carried out and results were visualized as described for D. The upper and lower panels are presented as in D except that in the case of comparison of MFA2-A5 and MFA2-6xU(5′)-A5 RNAs, the RNA binding quantitated after the gel shift assays is shown as a percentage of RNA bound in each reaction (without normalization) in the bar diagram. Sequences of the relevant RNA substrates are shown at the bottom. (F) The difference in the binding affinity for the Lsm1p-7p–Pat1p complex of RNAs that bear or lack an uninterrupted stretch of Us near their 3′-ends disappears when they are oligoadenylated. The binding reactions were carried out and results were visualized as described for D. The upper and lower panels are presented as in D except that the bar diagram in the lower panel shows the percentage of RNA bound in each reaction without normalization. (Bottom) Sequences of the RNA substrates used for gel shifts. (G) Binding of the Lsm1p-7p–Pat1p complex to the oligoadenylated RNA cannot be competitively inhibited by oligo(A). (Upper panel) RNA-binding reactions were carried out as described in Materials and Methods using radiolabeled MFA2 RNA (lanes 1–5) or MFA2-A5 RNA (lanes 6–10) with the purified Lsm1p-7p–Pat1p complex (at a final concentration of 20.3 nM) that had been preincubated for 10 min at 30°C (before adding the radiolabeled RNA) in the presence of varying folds of molar excess (over the radiolabeled RNA) of oligo(A) (indicated above the lanes). After the reaction, gel shift of the RNA was visualized as described in Materials and Methods. (Lower panel) The percentage of the RNA bound in each reaction (quantitated from the gel using a PhosphorImager) is shown as a bar diagram directly under the corresponding lane of the gel picture. (* on the left in each figure) Positions of gel-shifted RNAs. (A,D,E,F, arrow on left) The smear observed below the band of gel-shifted RNA resulting from destabilization of the RNPs during the gel run.
FIGURE 7.
FIGURE 7.
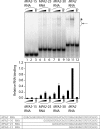
The shorter the RNA, the weaker is its binding to the Lsm1p-7p–Pat1p complex. (Top panel) RNA-binding reactions were carried out as described in Materials and Methods using various radiolabeled RNAs (indicated above the lanes) in the presence of the purified Lsm1p-7p–Pat1p complex at a final concentration of 8.12 nM (lanes 1,4,7,10) or 40.6 nM (lanes 2,5,8,11) or in the presence of BSA (lanes labeled with B on top). After the reaction, gel shift of the RNA was visualized as described in Materials and Methods. (*) Position of gel-shifted RNA. (Arrow) The smear observed below the band of gel-shifted RNA due to the destabilization of the RNPs during the gel run. (Middle panel) The fraction of the RNA bound in each reaction (quantitated from the gel using PhosphorImager) normalized to the value obtained with MFA2 RNA at 40.6 nM concentration of the purified complex is shown as a bar diagram directly under the corresponding lane of the gel picture. (Bottom panel) Sequences of the RNA substrates used for the gel shift assays.

Similar articles

Cited by

References

    1. Achsel, T., Brahms, H., Kastner, B., Bachi, A., Wilm, M., Luhrmann, R. A doughnut-shaped heteromer of human Sm-like proteins binds to the 3′-end of U6 snRNA, thereby facilitating U4/U6 duplex formation in vitro. EMBO J. 1999;18:5789–5802. - PMC - PubMed
    1. Achsel, T., Stark, H., Luhrmann, R. The Sm domain is an ancient RNA-binding motif with oligo(U) specificity. Proc. Natl. Acad. Sci. 2001;98:3685–3689. - PMC - PubMed
    1. Anantharaman, V., Aravind, L. Novel conserved domains in proteins with predicted roles in eukaryotic cell-cycle regulation, decapping and RNA stability. BMC Genomics. 2004;5:45. - PMC - PubMed
    1. Anderson, J.S.J., Parker, R.P. The 3′ to 5′ degradation of yeast mRNAs is a general mechanism for mRNA turnover that requires the SKI2 DEVH box protein and 3′ to 5′ exonucleases of the exosome complex. EMBO J. 1998;17:1497–1506. - PMC - PubMed
    1. Andrei, M.A., Ingelfinger, D., Heintzmann, R., Achsel, T., Rivera-Pomar, R., Luhrmann, R. A role for eIF4E and eIF4E-transporter in targeting mRNPs to mammalian processing bodies. RNA. 2005;11:717–727. - PMC - PubMed

Publication types

MeSH terms

LinkOut - more resources