. 2007 Jun;9(6):675-82.
doi: 10.1038/ncb1591. Epub 2007 May 7.

Positional stability of single double-strand breaks in mammalian cells

Affiliations

Positional stability of single double-strand breaks in mammalian cells

Evi Soutoglou et al. Nat Cell Biol. 2007 Jun.

Abstract

Formation of cancerous translocations requires the illegitimate joining of chromosomes containing double-strand breaks (DSBs). It is unknown how broken chromosome ends find their translocation partners within the cell nucleus. Here, we have visualized and quantitatively analysed the dynamics of single DSBs in living mammalian cells. We demonstrate that broken ends are positionally stable and unable to roam the cell nucleus. Immobilization of broken chromosome ends requires the DNA-end binding protein Ku80, but is independent of DNA repair factors, H2AX, the MRN complex and the cohesion complex. DSBs preferentially undergo translocations with neighbouring chromosomes and loss of local positional constraint correlates with elevated genomic instability. These results support a contact-first model in which chromosome translocations predominantly form among spatially proximal DSBs.


Figures
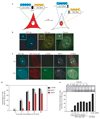
Figure 1
Figure 1
An experimental system to visualize single broken DNA ends. (a) Schematic representation of the L–ISceI–T array system. DSBs are triggered by treatment of cells with the steroid ligand triamcinolone acetonide (TA), resulting in redistribution of a RFP–ISceI–GR fusion protein (red) from the cytoplasm to the nucleus. (b) Visualization of the lac and the tet arrays in NIH2/4 cells after transient transfection of CFP–lacR and YFP–tetR. (c) Kinetics of DSBs and recruitment of DNA repair factors. Immmunofluorescence microscopy of NIH2/4 cells transiently transfected with CFP–lacR and RFP–ISceI–GR in the absence or presence of triamcinolone acetonide. Cells were stained with the indicated antibodies. On addition of triamcinolone acetonide, RFP–ISceI–GR translocates to the nucleus. In the absence of triamcinolone acetonide, RFP–ISceI–GR is cytoplasmic and no DSB recruitment of repair factors occurs. Arrowheads indicate the array. (d) Quantitative analysis of H2AX phosphorylation and recruitment kinetics of MDC1 and 53BP1 after addition of triamcinolone acetonide. Values represent averages ± s.d. (n = 100) from three independent experiments. (e) Ligation-mediated PCR in NIH2/4 cells at the indicated times after the addition of triamcinolone acetonide. NT, non-transfected cells. Cleavage levels were determined by comparison with a standard curve created by LM-PCR products from known ratios of naked DNA cleaved by ISceI in vitro to uncut DNA. Percentage of cells containing cleaved arrays was determined by normalizing for RFP–ISceI–GR and HA–ISceI transfection efficiencies. The scale bars in b and c represent 5 µm.
Figure 2
Figure 2
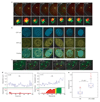
Analysis of the positional and local movement of broken DNA ends. (a) Representative time points of a time-lapse series 60 min after the addition of triamcinolone acetonide in a cell containing a single array. Each time point is a colour-combined maximum projection of three-dimensional stacks recorded in the CFP (red) and YFP (green) channels. The relative position of the two signals locally fluctuates over time (lower panel). (b) Visualization of CFP and YFP arrays several hours after the addition of triamcinolone acetonide. Arrowheads indicate the L–ISceI–T array. The percentage indicates cells with colocalized tags (n = 100 for each timepoint). (c) Time-lapse series 60 min after the addition of triamcinolone acetonide in a cell containing multiple arrays. Each time point is a colour-combined maximum projection of three-dimensional stacks recorded in the CFP (red) and YFP (green) channels. (d) Representative trajectories of CFP–YFP tag separation in the absence or presence of triamcinolone acetonide (blue line). Below the trajectories, coloured bars indicate the disjointedness probability (PD) for every 10-min window (red, PD <75%; yellow, 75 ≤ PD ≤ 95%; green, PD >95%). (e) Distribution of tag separation for control cells and cells with DSB. In the presence of DSBs, separation increases from ~0.1 µm to ~0.22 µm (P <10−5). Boxes indicate boundaries of the 25th percentile to the 75th percentile. The red line indicates the median of the data. Error bars indicate the spread of the data. Outliers are marked by red crosses, and are defined as data points that are further away than 1.5 times the width of the box. P values were obtained by t-test and represent pairwise comparisons of the indicated sample means. The scale bars represent 1 µm in a and c, and 2 µm in b. The dashed lines in a and c indicate the outline of the cells.
Figure 3
Figure 3
Separation of broken DNA ends in the absence of Ku80. (a) Localization of CFP and YFP arrays in the presence and absence of Ku80. Confocal microscopy in control and in Ku80-depleted NIH2/4 cells. Two examples of separated CFP and YFP arrays with different distances are presented. Separation was defined as a tag distance of >500 nm. The scale bars indicate 5 µm in a and c. Arrow indicates ISceI array. (b) Quantification of separated CFP and YFP signals in NIH2/4 cells depleted of the indicated repair factors or in controls cells. Values represent averages ± s.d. (n = 200) from three independent experiments. (c) Partial metaphase spreads of control or Ku80-depleted NIH2/4 cells 24 h after overexpression of HA–ISceI. Localization of the array at the end of a single chromosome 3 indicates the presence of a chromosome break. Arrowheads indicate the L–ISceI–T array. Probes against the entire array were used and the Lac and Tet portions of the array can not be distinguished. (d) Quantification of L–ISceI–T array signals on broken or translocated chromosomes. One hundred metaphases were analysed per sample. (e) Representative CFP–YFP tag separation trajectory in Ku80-depleted NIH2/4 cells. Below the trajectories, coloured bars indicate the disjointness probability (PD) for every 10-min window (red, PD <75%; yellow, 75 ≤ PD ≤ 95%; green, PD >95%). (f) Distribution of relative fluorescent tag mobility. Boxes indicate boundaries of the 25th percentile to the 75th percentile. The red line indicates the median of the data. Error bars indicate the spread of the data. Outliers are marked by red crosses, and are defined as data points that are further away than 1.5 times the width of the box. P values were obtained by t-test and represent pairwise comparisons of the indicated sample means.
Figure 4
Figure 4
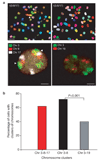
Spatial proximity of preferential translocation partners. (a) SKY analysis of Ku80-depleted NIH2/4 cells is shown in the upper panels. Arrowheads indicate the recurrent t(3:8/17). Visualization of the relative position by interphase FISH of dicentric chromosome 3 to chromosome 8 and t(8:17), or as a control to chromosome 19, is shown in the lower panels. Arrowheads indicate proximal pairs. Proximity was defined as physical touching of pixels representing distinct chromosomes. The scale bars represent 5 µm. (b) Quantification of the percentage of NIH2/4 cells containing proximal chromosome pairs. P values were obtained by x2 test.

Similar articles

Cited by

References

    1. Kanaar R, Hoeijmakers JH, van Gent DC. Molecular mechanisms of DNA double strand break repair. Trends Cell Biol. 1998;8:483–489. - PubMed
    1. Khanna KK, Jackson SP. DNA double-strand breaks: signaling, repair and the cancer connection. Nature Genet. 2001;27:247–254. - PubMed
    1. Elliott B, Jasin M. Double-strand breaks and translocations in cancer. Cell. Mol. Life Sci. 2002;59:373–385. - PMC - PubMed
    1. Meaburn KJ, Misteli T, Soutoglou E. Spatial genome organization in the formation of chromosomal translocations. Semin. Cancer Biol. 2007;17:80–90. - PMC - PubMed
    1. Nikiforova MN, et al. Proximity of chromosomal loci that participate in radiation-induced rearrangements in human cells. Science. 2000;290:138–141. - PubMed

Publication types

MeSH terms