. 2007 Jun;27(11):3920-35.
doi: 10.1128/MCB.01219-06. Epub 2007 Apr 2.

Upregulation of Twist-1 by NF-kappaB blocks cytotoxicity induced by chemotherapeutic drugs

Affiliations

Upregulation of Twist-1 by NF-kappaB blocks cytotoxicity induced by chemotherapeutic drugs

Can G Pham et al. Mol Cell Biol. 2007 Jun.

Abstract

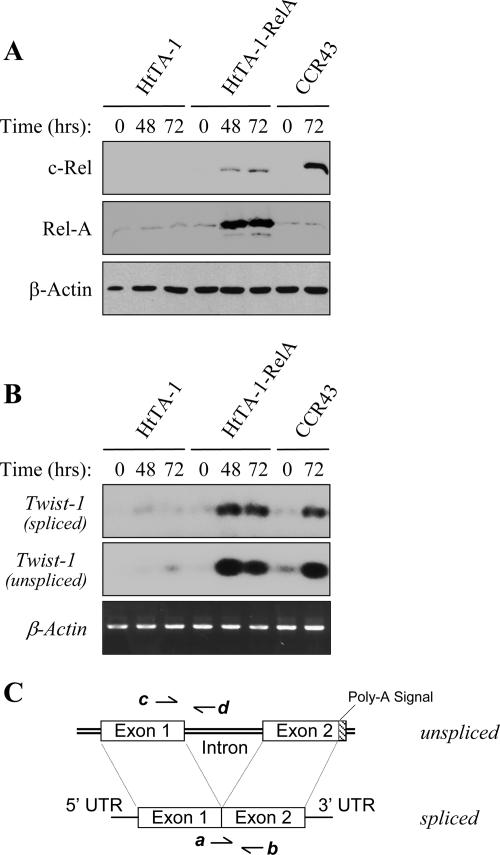
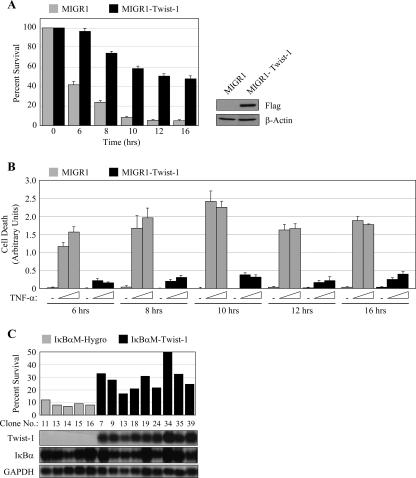
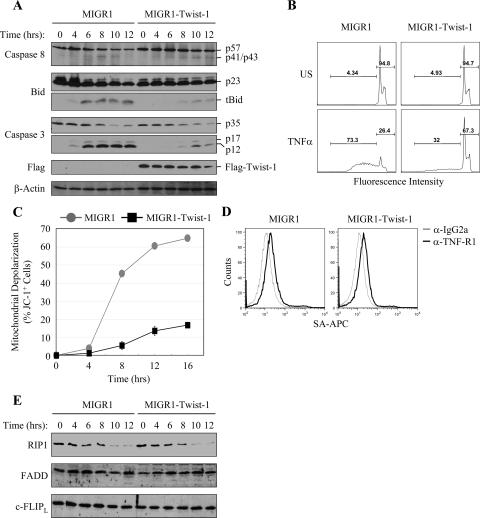
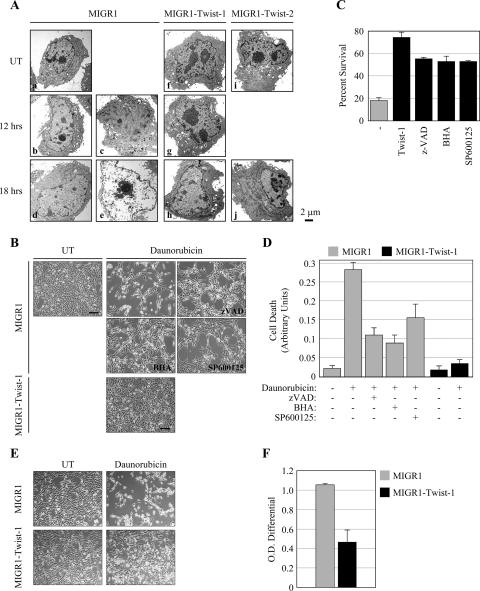
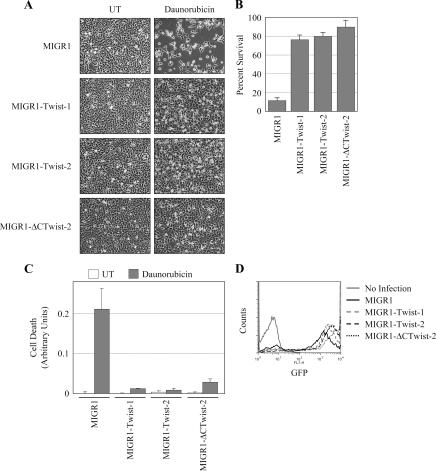
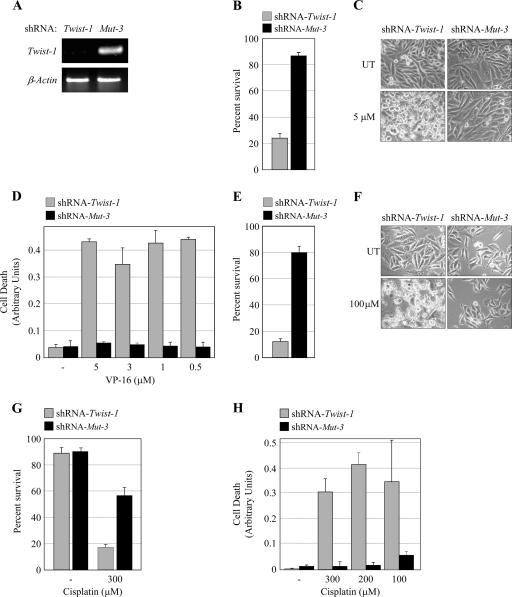
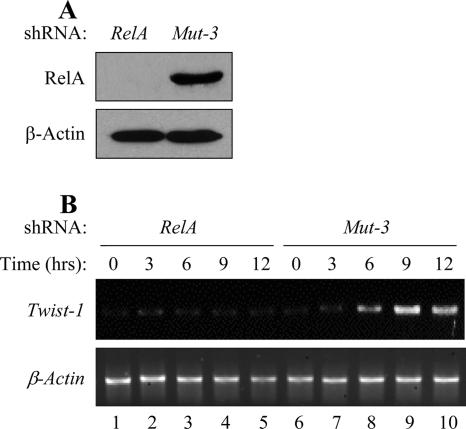
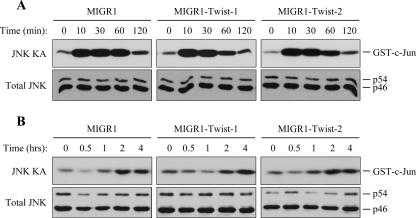
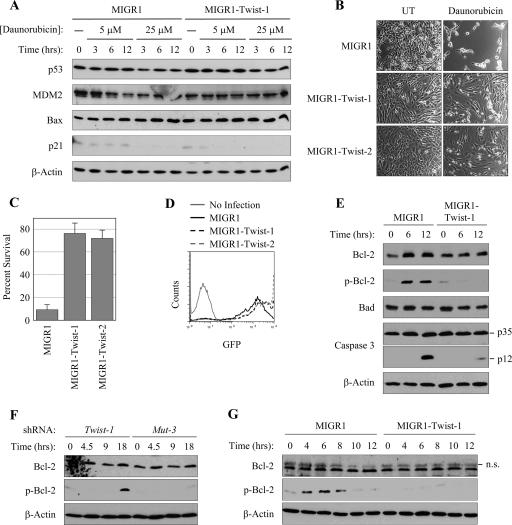
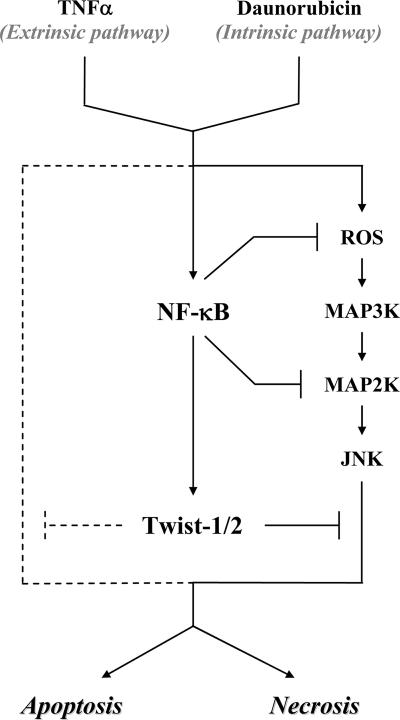
NF-kappaB/Rel transcription factors are central to controlling programmed cell death (PCD). Activation of NF-kappaB blocks PCD induced by numerous triggers, including ligand engagement of tumor necrosis factor receptor (TNF-R) family receptors. The protective activity of NF-kappaB is also crucial for oncogenesis and cancer chemoresistance. Downstream of TNF-Rs, this activity of NF-kappaB has been linked to the suppression of reactive oxygen species and the c-Jun-N-terminal-kinase (JNK) cascade. The mechanism by which NF-kappaB inhibits PCD triggered by chemotherapeutic drugs, however, remains poorly understood. To understand this mechanism, we sought to identify unrecognized protective genes that are regulated by NF-kappaB. Using an unbiased screen, we identified the basic-helix-loop-helix factor Twist-1 as a new mediator of the protective function of NF-kappaB. Twist-1 is an evolutionarily conserved target of NF-kappaB, blocks PCD induced by chemotherapeutic drugs and TNF-alpha in NF-kappaB-deficient cells, and is essential to counter this PCD in cancer cells. The protective activity of Twist-1 seemingly halts PCD independently of interference with cytotoxic JNK, p53, and p19(ARF) signaling, suggesting that it mediates a novel protective mechanism activated by NF-kappaB. Indeed, our data indicate that this activity involves a control of inhibitory Bcl-2 phosphorylation. The data also suggest that Twist-1 and -2 play an important role in NF-kappaB-dependent chemoresistance.


Figures

FIG. 1.
FIG. 1.
The activation of NF-κB complexes is sufficient for the transcriptional upregulation of Twist-1. (A) Western blots showing kinetics of induction of RelA and c-Rel in the HtTA-RelA and CCR43 cell lines, respectively, following the removal of tetracycline from the culture medium. As expected, the induction of RelA led to the upregulation of c-Rel, a known target of NF-κB (8). β-Actin is shown as the loading control. (B) RT-PCR showing the induction of mature (spliced) (top) and immature (unspliced) (middle) Twist-1 transcripts following the activation of RelA or c-Rel in HtTA-RelA and CCR43 cells, respectively, but not in control cells (HtTA-1). The PCR primers used are indicated in panel C. Times reflect the duration of the withdrawal of tetracycline prior to the extraction of the total RNA. No amplification signal was detected when samples from mock RT reactions were used as templates for PCR (data not shown) if any DNA contamination of the RNA samples is excluded. Southern blotting was performed using 32P-labeled probes specific for Twist-1 mRNAs (top and middle). Also shown as loading controls are the ethidium bromide-stained β-actin products. (C) Schematic representation of the relative localizations within the Twist-1 locus of PCR primers a and b and of primers c and d, used for the detection of spliced and unspliced Twist-1 transcripts, respectively. UTR, untranscribed region.
FIG. 2.
FIG. 2.
Twist-1 attenuates TNF-α-induced PCD in NF-κB-deficient cells. (A) The ectopic expression of Twist-1 rescues RelA null fibroblasts from TNF-α-induced PCD. MIGR1- and MIGR1-Twist-1-transduced-RelA/ cells were seeded onto 60-mm dishes at a density of 0.5 × 10⁶ cells/dish and, 24 h later, treated either with cycloheximide (CHX) alone (0.1 μg/ml) or with CHX (0.1 μg/ml) plus TNF-α (100 U/ml). At the times indicated, cell viability was assessed by determining total cell numbers in both TNF-α-treated and control cultures. For this, adherent cells were recovered by trypsinization followed by centrifugation, resuspended in serum-containing medium, and counted by hemacytometry (36). Fractions of GFP+ cells were assessed by FCM. Values reflect the percentages of live (i.e., adherent) GFP+ cells (determined by combining cell counting and FCM) relative to the numbers observed in cultures treated with CHX alone (left). These percentages represent means ± standard deviations from three independent experiments. Levels of ectopic Flag-Twist were monitored by Western blotting (right). (B) ELISAs of PCD confirming the protective activity of ectopic Twist-1 in RelA null cells. Cell death was monitored in the same MIGR1- and MIGR1-Twist-1 RelA-deficient lines used to obtain the panel A results, following treatment with CHX alone (0.1 μg/ml) or together with a low (100 U/ml) or high (250 U/ml) concentration of TNF-α, as indicated. Treatment times are also shown. Assays were preformed as described previously (33, 36), and cell death is expressed as arbitrary units. Values represent means ± standard deviations from three independent experiments. (C) Survival of representative Hygro- and Twist-1-expressing, 3DO-IκBαM clones (IκBαM-Hygro and IκBαM-Twist-1, respectively) after treatment with TNF-α. For survival assays, cells were plated onto 24-well dishes at 3.5 × 10⁵ cells/well and then exposed to TNF-α (15 U/ml) or left untreated. Viability was assessed at 6 h by performing PI nuclear staining assays. DNA content was determined with FCM analysis and analyzed using the FlowJo software. Percentages of survival reflect fractions of live cells (i.e., of at least G1 DNA content) in the TNF-α-treated cultures relative to the number of live cells in the untreated cultures (top). Clone numbers are shown. Levels of expression of Twist-1, IκBα, and GAPDH mRNAs in each clone were monitored by Northern blotting (bottom).
FIG. 3.
FIG. 3.
Twist-1 antagonizes apoptotic signaling induced by TNF-α in RelA/ cells. (A) Western blots showing that Twist-1 is capable of suppressing TNF-α-induced caspase activation and Bid processing. MIGR1- and MIGR1-Twist-1-transduced RelA/ cells were seeded as described for Fig. 2A and stimulated with TNF-α (100 U/ml) plus CHX (0.1 μg/ml). At the times indicated, extracts were prepared from TNF-α-treated and control cultures (i.e., 0-hour time points) and used to assess the kinetics of activation of caspase-8 (p57), caspase-3, and Bid as determined by immunoblotting. Also indicated are the levels of ectopically expressed Twist-1. β-Actin is shown as the loading control. Antibodies and intact and cleaved polypeptide products are indicated (on the left- and right-hand sides, respectively). (B) PI nuclear staining assays showing that TNF-α-induced DNA fragmentation in RelA/ cells is blocked by the ectopic expression of Twist-1. FCM histogram profiles showing DNA content in MIGR1- and MIGR1-Twist-1-transduced RelA/ cells which were either left untreated (i.e., CHX alone) (unstimulated [US] panels) or treated with TNF-α (100 U/ml) plus CHX (0.1 μg/ml) (TNFα panels), as indicated. Cells were collected 14 h after these treatments, and DNA fragmentation in these cultures was assessed by performing PI nuclear staining followed by FCM analysis. Values represent percentages of cells manifesting sub-G1 and at least G1 DNA contents, as shown. (C) Twist-1 effectively inhibits MOMP triggered by TNF-α in RelA/ cells. Mitochondrial depolarization in MIGR1- and Twist-1-transduced RelA/ cultures treated with CHX alone or together with TNF-α, as described for panel A, was determined by performing JC-1 fluorescence staining. At 4, 8, 12, and 16 h after TNF-α stimulation, detached and adherent cells were harvested, pooled, washed with phosphate-buffered saline (PBS), and then loaded with JC-1 (10 μg/ml in PBS) and incubated at 37°C for 30 min. Cells were then washed three additional times with PBS and analyzed by FCM. Shown are percentages of JC-1+ cells relative to those in cultures treated with CHX alone and reflect means ± standard deviations from three independent experiments. (D) FCM analysis showing comparable levels of surface expression of TNF-R1 in MIGR1- and MIGR1-Twist-1-transduced cells. Cells were stained with a biotin-labeled anti-TNF-R1 antibody (α-TNF-R1) (black line) or a biotin-labeled isotype-matched control (anti-immunoglobulin G2a [α-IgG2a]) (gray line), as indicated, followed by incubation with streptavidin-APC (SA-APC), and FCM was performed using standard methods. FCM histogram profiles depict APC positivity in MIGR1- and MIGR1-Twist-1-infected RelA/ cultures and were generated using the FlowJo software as described for Fig. 2C. (E) Western blots showing levels of the indicated proteins in MIGR1- and MIGR1-Twist-1-transduced cells treated with TNF-α and CHX or left untreated (0 h-time points) as described for panel A. Extracts were the same as those used to obtain the panel A results. Antibodies are indicated.
FIG. 4.
FIG. 4.
Twist-1 blocks both apoptosis and necrosis-like PCD induced by a chemotherapeutic drug. (A) TEM images showing morphological changes in MIGR1- and MIGR1-Twist-1-transduced RelA/ cells following the induction of PCD by treatment with daunorubicin (5 μM) for 12 and 18 h, as shown. TEM images of representative cells are shown. Treated, control cells (MIGR1) manifest changes consistent with both apoptotic (images b and d) and necrotic (images c and e) PCD. These include chromatin and organelle condensation (characteristic of apoptotic cells) and nuclear disintegration and generalized cell swelling and disorganization (characteristic of necrotic cells) with shells found at late time points (image e). In contrast, daunorubicin-treated RelA/ cells expressing Twist-1 or Twist-2 (MIGR1-Twist-1 or MIGR1-Twist-2, respectively) by and large retained morphologies similar to those in untreated (UT) cultures (images f, g, and i), even at late times (images h and j), although some signs of apoptosis, such as chromatin condensation, could be observed in some cells at these times (image h). (B) Light microscopic images showing that the pan-caspase inhibitor zVAD-fmk, the antioxidant BHA, and the JNK inhibitor SP600125 can only partially protect MIGR1-transduced RelA/ cells against cytotoxicity induced by daunorubicin. MIGR1-transduced-RelA/ cultures were seeded in 60-mm dishes as described for Fig. 2A and then left untreated (−) or treated with zVAD-fmk (50 μM), BHA (100 μM), or SP600125 (50 μM), as shown. Twenty minutes later, where indicated, cells were exposed to daunorubicin (7.5 μM). Control cultures were left untreated (UT). After 16 h of cytotoxic treatment, cell viability was assessed by microscopic inspection, using an Axiovert S-100 Zeiss microscope with a 10× objective. Photos showing these cultures were acquired using Zeiss software. Pretreatments with zVAD, BHA, or SP600125 improved the survival of MIGR1-transduced RelA/ cells (MIGR1) treated with daunorubicin, compared to that of nonpretreated cells. Also shown is the superior protection afforded by ectopic Twist-1 (MIGR1-Twist-1) against daunorubicin-induced cytotoxicity in RelA/ cells. (C) Percentages of survival calculated for the cultures depicted in panel B. This viability was extrapolated by normalizing numbers of live cells in daunorubicin-treated cultures to the numbers of live cells in transduced RelA/ cultures that were not exposed to daunorubicin. -, no pretreatment. Values are means ± standard deviations from three separate measurements. (D) ELISAs of PCD confirming the protective activity of ectopic Twist-1 in RelA null cells. Assays were performed using the same MIGR1- and MIGR1-Twist-1-trasduced, RelA-deficient lines used to obtain the results in panels B and C. Treatment with daunorubicin was at 5 μM, and pretreatments with zVAD-fmk, BHA, and SP600125 were carried out as described for panels B and C, as indicated. Cells were harvested after a 16-hour treatment with daunorubicin, and assays were preformed as described for Fig. 2B. Cell death is expressed as arbitrary units and is shown for both treated and untreated cultures. Values represent means ± standard deviations from three independent experiments. (E) Twist-1 effectively blocks daunorubicin-induced cytotoxicity in RelA/ cells. Light microscopic images depicting the viability of MIGR1- and MIGR1-Twist-1-transduced RelA/ cells, seeded as described for Fig. 3A, and left untreated or treated with daunorubicin at a lower concentration than that used for panel B results (i.e., 5 μM) for 15 h. Photos were acquired as described for panel B. (F) MTS assays showing daunorubicin-induced cytotoxicity in MIGR1- and MIGR1-Twist-1-transduced RelA/ cells. Cells were seeded onto 96-well plates at 104 cells/well and were left untreated or treated with daunorubicin (5 μM) for 15 h. Cultures were then supplemented with 20 μl of CellTiter96AQ reagent (Promega, Madison, WI) and incubated at 37°C for 1 h, and optical densities (O.D.) of the culture supernatants were finally measured using a SpectraMAX 250 microplate spectrophotometer (Molecular Devices) at A490. Values are the differences in optical densities between daunorubicin-treated and untreated cultures (i.e., the optical densities of the untreated cultures minus those of the treated cultures) and represent means ± standard deviations from three independent experiments.
FIG. 5.
FIG. 5.
Twist proteins block daunorubicin-induced PCD through a mechanism that does not involve an interaction with NF-κB dimers. (A) Light microscopic images showing that ΔCTwist-2 effectively rescues RelA/ cells from cytotoxicity induced by daunorubicin. RelA/ cells were infected with the indicated MIGR1 retrovirues, seeded onto 60-mm dishes as described for Fig. 2A, and then left untreated (UT) or treated with daunorubicin (7.5 μM) as shown. After a 15-hour treatment, cell viability was assessed by microscopic inspection as detailed in the legend to Fig. 4B, using an Axiovert S-100 Zeiss microscope with a 10× objective. Shown are comparable levels of protection afforded by ectopic Twist-1, Twist-2, and ΔCTwist-2 (MIGR1-Twist-1, MIGR1-Twist-2, and MIGR1-ΔCTwist-2 images, respectively) against daunorubicin-induced PCD in RelA/ cells. (B) Percentages of survival calculated for the cultures depicted in panel A. Viability was extrapolated as described for Fig. 4C by normalizing numbers of live cells in the daunorubicin-treated cultures to the numbers of cells in the corresponding untreated cultures. Values are means ± standard deviations of three indipendent measurements. (C) ELISAs showing PCD in cultures of RelA null cells transduced with MIGR1, MIGR1-Twist-1, MIGR1-Twist-2, or MIGR1-ΔCTwist-2, as shown. Cells were treated with daunorubicin (5 μM) for 16 h or left untreated as indicated. Cell lines were the same those used to obtain the results in panels A and B, and assays were preformed as described in the legend to Fig. 2B. Cell death is expressed as arbitrary units and is shown for both treated and untreated (UT) cultures. Values represent means ± standard deviations from three independent experiments. (D) Comparable levels of infection efficiency by MIGR1 retroviruses of the RelA/ cultures used to obtain the results shown in panels A to C. FCM histogram profiles showing eGFP positivity in the MIGR1-, MIGR1-Twist-1-, MIGR1-Twist-2-, and MIGR1-ΔCTwist-2-infected RelA/ cells shown in panels A to C and uninfected RelA/ controls (No Infection), as indicated. Cells were harvested 48 h after first being exposed to the retroviral preparations, and eGFP positivity in these cultures was assessed by FCM, followed by analysis with the FlowJo software, as described for Fig. 2C. The bar indicates fractions of GFP+ cells.
FIG. 6.
FIG. 6.
Twist-1 is required to antagonize cytotoxicity induced by chemotherapeutic drugs in PC-3 prostate cancer cells. (A) RT-PCR showing the downregulation of Twist-1 transcripts following the infection of PC-3 cells with pLL lentiviruses expressing Twist-1-specific, but not control (lane Mut-3), shRNA, as indicated. Shown are ethidium bromide-stained Twist-1 and β-actin PCR products. Several anti-Twist-1 antibodies were tested for immunoblot detection of endogenous Twist-1 polypeptides and found unsuitable for this purpose (C. Bubici and G. Franzoso, unpublished observations). (B) Percentages of survival of PC-3 cells infected with lentiviruses expressing Twist-1-specific or control (Mut-3) shRNA, as indicated. Cells were seeded onto a 12-well plate at 4 ×10⁴ cells/dish and then left untreated or treated with VP-16 (etoposide, 5 μM) for 48 h. Viability was calculated from the same cultures used to obtain the results depicted in panel C, and values were extrapolated as described for Fig. 4C, by normalizing numbers of live cells in the VP-16-treated cultures to the numbers of live cells in the corresponding untreated cultures. Values are means ± standard deviations of three independent measurements. (C) Light microscopic images showing that expression of Twist-1 shRNAs renders PC-3 cells highly sensitive to cytotoxicity induced by VP-16. Lentiviral infections and cytotoxic treatments were as described for panel B. VP-16-treated (5 μM) and untreated (UT) cells are shown. Forty-eight hours after the addition of VP-16 to the culture medium, cell viability was assessed by microscopic inspection, using an Axiovert S-100 Zeiss microscope with a 10× objective. (D) ELISAs showing cell death in VP-16-treated and untreated PC-3 cells expressing either Twist-1-specific or Mut-3 shRNA, as indicated. Cells were left untreated (−) or treated with the indicated concentrations of VP-16 for 48 h, and ELISAs were preformed as described in the legend to Fig. 2B. Cell death is expressed as arbitrary units, and values are means ± standard deviations from three independent experiments. (E) Percentages of survival of PC-3 cells infected with pLL lentivirues expressing Twist-1-specific or control (Mut-3) shRNA as described for panel B and then left untreated or treated with cisplatin (100 μM) for 22 h as indicated. Viability was extrapolated from the cultures used to obtain the results depicted in panel F, as for panel B, by normalizing numbers of live cells in the cisplatin-treated cultures to the numbers of live cells in the corresponding untreated cultures. Values are the means ± standard deviations of three independent measurements. (F) Light microscopic images showing that Twist-1 shRNA markedly sensitizes PC-3 cells to cisplatin-induced cytotoxicity. Cells were infected with pLL lentivirues and then left untreated (UT) or treated with cisplatin (100 μM) as shown. After a 22-hour treatment, cell viability was assessed by microscopic inspection, using an Axiovert S-100 Zeiss microscope with a 10× objective. (G) PI nuclear staining of PC-3 cells expressing Twist-1-specific or control shRNAs after treatment with cisplatin (300 μM) or culture medium (−) for 17 h. The assays show that cisplatin-induced DNA fragmentation in PC-3 cells is markedly enhanced by the knockdown of Twist-1. Lentiviral infections and cell plating were as described for panel E. PI nuclear-staining assays were performed as described for Fig. 2C, and DNA content was determined by using FCM followed by analysis with the FlowJo software. Percent survival reflects the fractions of live cells (i.e., containing at least G1 DNA) in untreated (−) and cisplatin-treated (300 μM) cultures, as indicated. Values are the means ± standard deviations of three independent measurements. (H) ELISAs showing cell death in cisplatin-treated and untreated PC-3 cells expressing either Twist-1-specific or Mut-3 shRNA, as indicated. Cells were left untreated (−) or treated with the indicated concentrations of cisplatin for 22 h, and ELISAs were preformed as described for Fig. 2B. Cell death is expressed as arbitrary units, and values are means ± standard deviations from three independent experiments.
FIG. 7.
FIG. 7.
Upregulation of Twist-1 by daunorubicin requires NF-κB. (A) Western blots showing the downregulation of RelA proteins in PC-3 cells infected with pLL lentivirues expressing RelA-specific, but not control (lane Mut-3), shRNA. β-Actin is shown as a loading control. (B) RT-PCR showing kinetics of upregulation of Twist-1 mRNAs following treatment with daunorubicin (3 μM) in PC-3 cells expressing control shRNAs (lanes Mut-3) but not in cells expressing RelA-specific shRNAs. Times (in hours) reflect the duration of treatment with daunorubicin prior to extraction of the total RNA. Also shown, as a loading control, are the ethidium bromide-stained β-actin PCR products.
FIG. 8.
FIG. 8.
Twist-1 and Twist-2 fail to modulate the activation of the JNK pathway by TNF-α or daunorubicin in RelA/ cells. (A) JNK kinase assays (top) showing kinetics of JNK induction in control-, Twist-1-expressing-, and Twist-2-expressing RelA/ cells (MIGR1, MIGR1-Twist-1, and MIGR1-Twist-2 lanes, respectively) after exposure to TNF-α (100 U/ml) plus CHX (0.1 μg/ml) for the times indicated. Extracts were prepared from treated and untreated cells and then analyzed for JNK activity as detailed in reference . Briefly, JNK was immunoprecipitated with an anti-JNK-specific antibody and then subjected to kinase assays using GST-c-Jun as the substrate in the presence of [γ-32P]ATP (top). Western blots showing total JNK levels in the extracts as the loading controls (bottom). (B) JNK kinase assays (top) showing kinetics of JNK induction in control, Twist-1-expressing-, and Twist-2-expressing RelA/ cells (MIGR, MIGR1-Twist-1, and MIGR1-Twist-2 lanes, respectively) after exposure to daunorubicin (5 μM) for the times indicated. Extracts were prepared from treated and untreated cells and analyzed for JNK activity as described for panel A. Western blots showing total JNK levels as the loading control (bottom).
FIG. 9.
FIG. 9.
The protective activity of Twist factors against daunorubicin-induced killing is independent of an interference with the p53 and p19ARF pathways and involves instead a suppression of inhibitory Bcl-2 phosphorylation. (A) p53 function is compromised in immortalized RelA/ 3T3 fibroblasts. RelA/ 3T3 fibroblasts fail to upregulate p53 and p53 targets genes following exposure to daunorubicin. Western blots showing levels of p53 and the p53 targets p21, MDM2, and Bax in MIGR1- and MIGR1-Twist-1-transduced RelA/ fibroblasts prior to and after exposure to the indicated doses of daunorubicin. At the times shown, cell extracts were prepared and analyzed by immunoblotting. Levels of none of the examined polypeptides were upregulated by these treatments. The specific antibodies used are labeled on the left-hand side. p21 levels were almost undetectable even after exposure to daunorubicin, despite the fact that these levels were readily detected in control extracts (data not shown). β-Actin is shown as a loading control. (B) Light microscopic images showing that the expression of Twist-1 and Twist-2 effectively rescues p19ARF/ cells from daunorubicin-induced cytotoxicity. p19ARF/ cells were infected with the indicated retrovirues, seeded onto 60-mm dishes as described for Fig. 2A, and then left untreated (UT) or treated with daunorubicin (5 μM) as shown. After a 15-hour treatment, cell viability was assessed by microscopic inspection, as detailed in the legend to Fig. 4B, using an Axiovert S-100 Zeiss microscope with a 10× objective. (C) Percentages of survival calculated for the cultures depicted in panel B. The viability of these cells was extrapolated as described for Fig. 4C by normalizing numbers of live p19ARF/ cells in the daunorubicin-treated cultures to the numbers of live cells in the corresponding untreated cultures. Values are the means ± standard deviations of three independent measurements. (D) Comparable infection efficiencies of the p19ARF/ cells used to obtain the results shown in panels B and C. FCM histogram profiles showing eGFP positivity in the MIGR1-, MIGR1-Twist-1-, MIGR1-Twist-2-infected p19ARF/ cells used to obtain the results shown in panels B and C and uninfected p19ARF/ controls (No Infection), as indicated. Cells were harvested after infection as described for Fig. 5D, and eGFP positivity was assessed by performing FCM followed by analysis with the FlowJo software (detailed in the legend to Fig. 2B). The bar indicates fractions of GFP+ cells. (E) Western blots showing that Twist-1 expression prevents daunorubicin-induced Bcl-2 phosphorylation on Ser-87 in RelA/ 3T3 cells. RelA/ cells were transduced with either MIGR1 or MIGR1-Twist-1 retroviruses, as indicated, and left untreated or treated with daunorubicin (5 μM) for the times shown. Antibodies and intact and cleaved caspase-3 products are indicated on the left- and right-hand sides, respectively. β-Actin is shown as the loading control. (F) Twist-1 is essential to prevent Bcl-2 phosphorylation induced by anticancer drugs. Western blots showing levels of total and phospho-Bcl-2 in VP-16-treated PC-3 cells expressing either Twist-1-specific or Mut-3 shRNAs, as indicated. Transduced PC-3 lines were the same as those used to obtain the results shown in Fig. 6B to D and were left untreated (0-hour time points) or treated with VP-16 (5 μM) for the times indicated. The antibodies used are labeled on the left-hand side. β-Actin is shown as the loading control. (G) Western blots showing levels of total and phosphorylated Bcl-2 (on Ser-87) in MIGR1- and MIGR1-Twist-1-infected RelA null cells that were either left untreated (0-h time points) or treated with TNF-α and CHX as described for Fig. 3A. MIGR1- and MIGR1-Twist-1-transduced cells were as indicated. The antibodies used are labeled on the left-hand side. β-Actin is shown as the loading control. n.s., nonspecific.
FIG. 10.
FIG. 10.
The upregulation of Twist genes mediates a novel protective mechanism that is activated by NF-κB to block apoptosis and necrosis signaling. TNF-α and daunorubicin activate the extrinsic and intrinsic pathways of PCD, respectively, at least in part, through ROS-dependent induction of the JNK mitogen-activated protein kinase cascade. Signaling mechanisms transduced by these cytotoxic elements then contribute to both apoptotic and necrotic PCD. Concomitantly, they also induce NF-κB, which effectively antagonizes PCD triggered by these stimuli by upregulating the expression of downstream targets such as Twist-1 and Twist-2. The mechanism(s) by which NF-κB blocks PCD signaling appears to involve inhibition of both JNK-dependent (solid line) and JNK-independent (dashed line) cytotoxic mechanisms. It seems to be, however, the latter mechanism that is primarily targeted by Twist proteins.

Similar articles

Cited by

References

    1. Basu, A., G. DuBois, and S. Haldar. 2006. Posttranslational modifications of Bcl2 family members—a potential therapeutic target for human malignancy. Front. Biosci. 11:1508-1521. - PubMed
    1. Benhar, M., D. Engelberg, and A. Levitzki. 2002. ROS, stress-activated kinases and stress signaling in cancer. EMBO Rep. 3:420-425. - PMC - PubMed
    1. Carroll, A. G., H. J. Voeller, L. Sugars, and E. P. Gelmann. 1993. p53 oncogene mutations in three human prostate cancer cell lines. Prostate 23:123-134. - PubMed
    1. Castanon, I., and M. Baylies. 2002. A twist in fate: evolutionary comparison of Twist structure and function. Gene 287:11-22. - PubMed
    1. Chen, Z. F., and R. R. Behringer. 1995. twist is required in head mesenchyme for cranial neural tube morphogenesis. Genes Dev. 9:686-699. - PubMed

Publication types

MeSH terms