Fast automated cell phenotype image classification
- PMID: 17394669
- PMCID: PMC1847687
- DOI: 10.1186/1471-2105-8-110
Fast automated cell phenotype image classification
Abstract
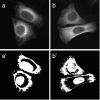
Background: The genomic revolution has led to rapid growth in sequencing of genes and proteins, and attention is now turning to the function of the encoded proteins. In this respect, microscope imaging of a protein's sub-cellular localisation is proving invaluable, and recent advances in automated fluorescent microscopy allow protein localisations to be imaged in high throughput. Hence there is a need for large scale automated computational techniques to efficiently quantify, distinguish and classify sub-cellular images. While image statistics have proved highly successful in distinguishing localisation, commonly used measures suffer from being relatively slow to compute, and often require cells to be individually selected from experimental images, thus limiting both throughput and the range of potential applications. Here we introduce threshold adjacency statistics, the essence which is to threshold the image and to count the number of above threshold pixels with a given number of above threshold pixels adjacent. These novel measures are shown to distinguish and classify images of distinct sub-cellular localization with high speed and accuracy without image cropping.
Results: Threshold adjacency statistics are applied to classification of protein sub-cellular localization images. They are tested on two image sets (available for download), one for which fluorescently tagged proteins are endogenously expressed in 10 sub-cellular locations, and another for which proteins are transfected into 11 locations. For each image set, a support vector machine was trained and tested. Classification accuracies of 94.4% and 86.6% are obtained on the endogenous and transfected sets, respectively. Threshold adjacency statistics are found to provide comparable or higher accuracy than other commonly used statistics while being an order of magnitude faster to calculate. Further, threshold adjacency statistics in combination with Haralick measures give accuracies of 98.2% and 93.2% on the endogenous and transfected sets, respectively.
Conclusion: Threshold adjacency statistics have the potential to greatly extend the scale and range of applications of image statistics in computational image analysis. They remove the need for cropping of individual cells from images, and are an order of magnitude faster to calculate than other commonly used statistics while providing comparable or better classification accuracy, both essential requirements for application to large-scale approaches.
Figures


Similar articles
-
Automated protein subcellular localization based on local invariant features.Protein J. 2013 Mar;32(3):230-7. doi: 10.1007/s10930-013-9478-1. Protein J. 2013. PMID: 23512411
-
Visualizing and clustering high throughput sub-cellular localization imaging.BMC Bioinformatics. 2008 Feb 4;9:81. doi: 10.1186/1471-2105-9-81. BMC Bioinformatics. 2008. PMID: 18241353 Free PMC article.
-
Efficient computational model for classification of protein localization images using Extended Threshold Adjacency Statistics and Support Vector Machines.Comput Methods Programs Biomed. 2018 Apr;157:205-215. doi: 10.1016/j.cmpb.2018.01.021. Epub 2018 Feb 2. Comput Methods Programs Biomed. 2018. PMID: 29477429
-
A review of image analysis and machine learning techniques for automated cervical cancer screening from pap-smear images.Comput Methods Programs Biomed. 2018 Oct;164:15-22. doi: 10.1016/j.cmpb.2018.05.034. Epub 2018 Jun 26. Comput Methods Programs Biomed. 2018. PMID: 30195423 Review.
-
Toward the virtual cell: automated approaches to building models of subcellular organization "learned" from microscopy images.Bioessays. 2012 Sep;34(9):791-9. doi: 10.1002/bies.201200032. Epub 2012 Jul 10. Bioessays. 2012. PMID: 22777818 Free PMC article. Review.
Cited by
-
Scaling multi-instance support vector machine to breast cancer detection on the BreaKHis dataset.Bioinformatics. 2022 Jun 24;38(Suppl 1):i92-i100. doi: 10.1093/bioinformatics/btac267. Bioinformatics. 2022. PMID: 35758811 Free PMC article.
-
Advanced disk herniation computer aided diagnosis system.Sci Rep. 2024 Apr 5;14(1):8071. doi: 10.1038/s41598-024-58283-5. Sci Rep. 2024. PMID: 38580700 Free PMC article.
-
In Situ Classification of Cell Types in Human Kidney Tissue Using 3D Nuclear Staining.Cytometry A. 2021 Jul;99(7):707-721. doi: 10.1002/cyto.a.24274. Epub 2020 Dec 13. Cytometry A. 2021. PMID: 33252180 Free PMC article.
-
Automated analysis and reannotation of subcellular locations in confocal images from the Human Protein Atlas.PLoS One. 2012;7(11):e50514. doi: 10.1371/journal.pone.0050514. Epub 2012 Nov 30. PLoS One. 2012. PMID: 23226299 Free PMC article.
-
Histopathological Classification of Breast Cancer Images Using a Multi-Scale Input and Multi-Feature Network.Cancers (Basel). 2020 Jul 24;12(8):2031. doi: 10.3390/cancers12082031. Cancers (Basel). 2020. PMID: 32722111 Free PMC article.
References
-
- Stow J.L. Teasdale R.D. Expression and localization of proteins in mammalian cells. In: Little P., Quackenbush J., editor. Encyclopedia of Genetics, Genomics, Proteomics and Bioinformatics. John Wiley and Sons; 2005.
-
- Bonetta L. Flow cytometry smaller and better. Nature Methods. 2005;2:785 –7795. doi: 10.1038/nmeth1005-785. - DOI
Publication types
MeSH terms
LinkOut - more resources
Full Text Sources
Other Literature Sources

