

In vivo-restricted and reversible malignancy induced by human herpesvirus-8 KSHV: a cell and animal model of virally induced Kaposi's sarcoma
- PMID: 17349582
- PMCID: PMC2180156
- DOI: 10.1016/j.ccr.2007.01.015
In vivo-restricted and reversible malignancy induced by human herpesvirus-8 KSHV: a cell and animal model of virally induced Kaposi's sarcoma
Erratum in
- Cancer Cell. 2007 May;11(5):471
Abstract
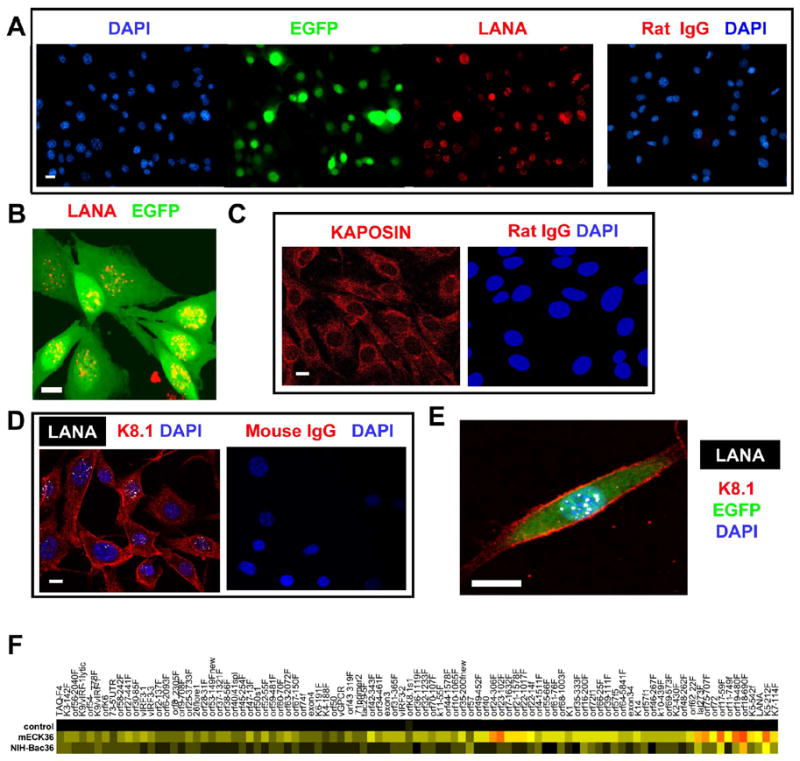
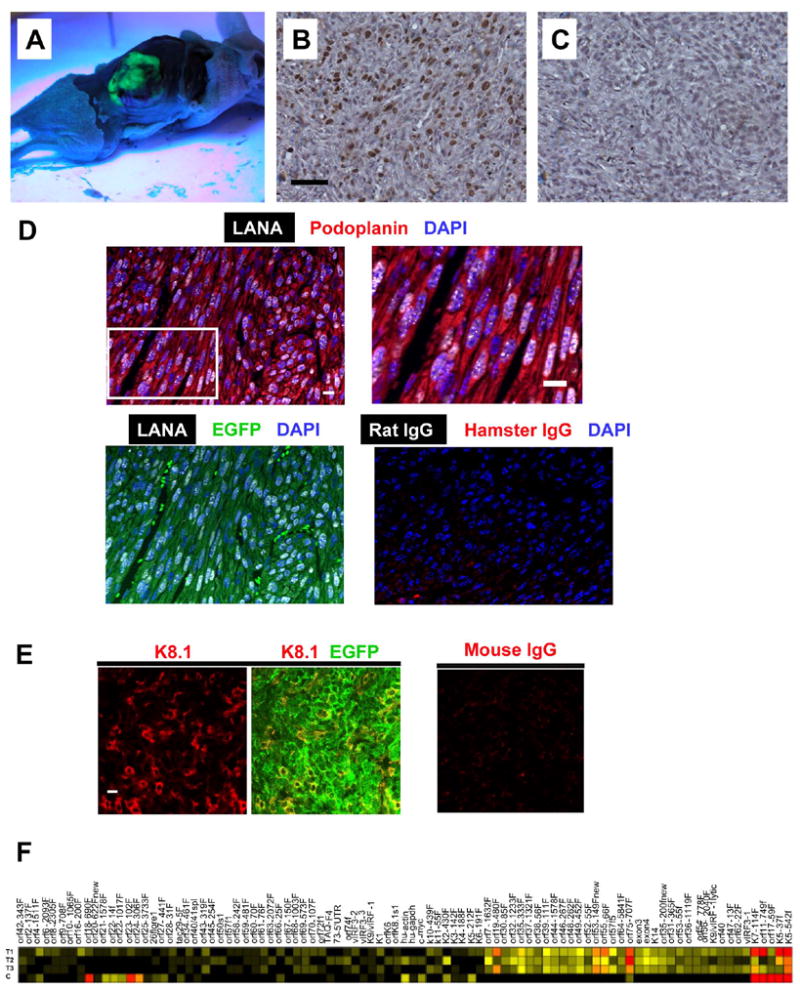
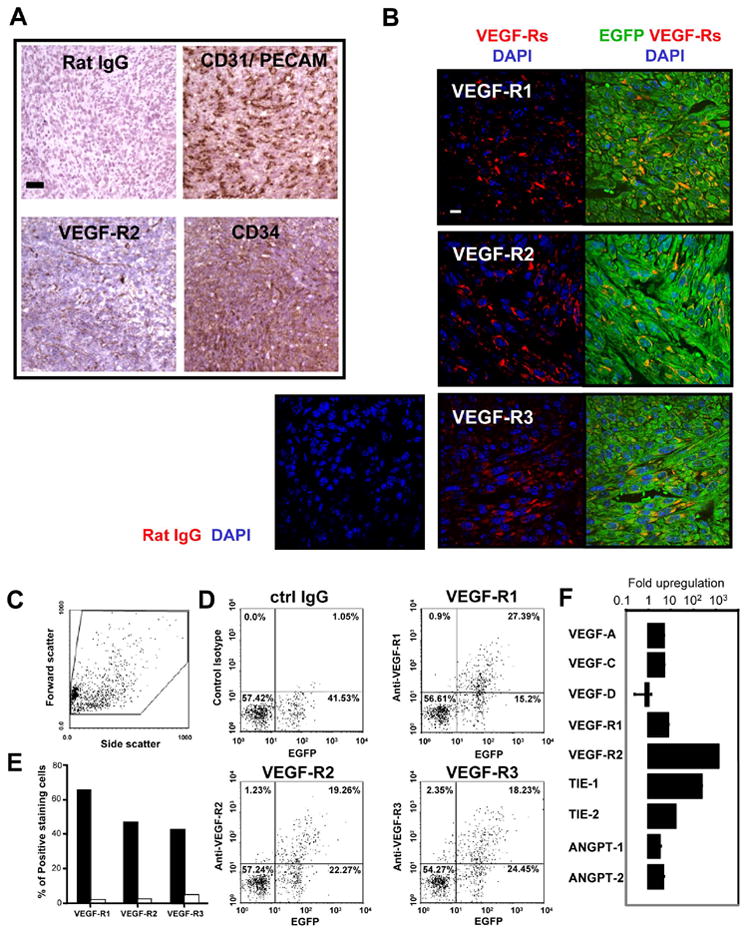
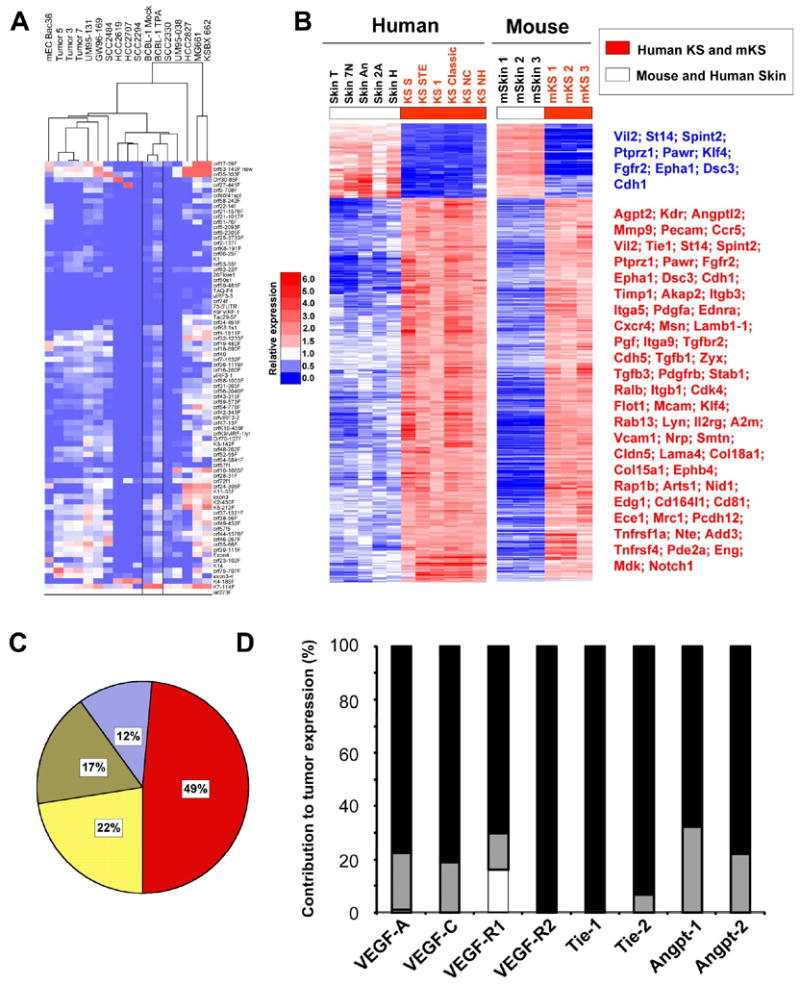
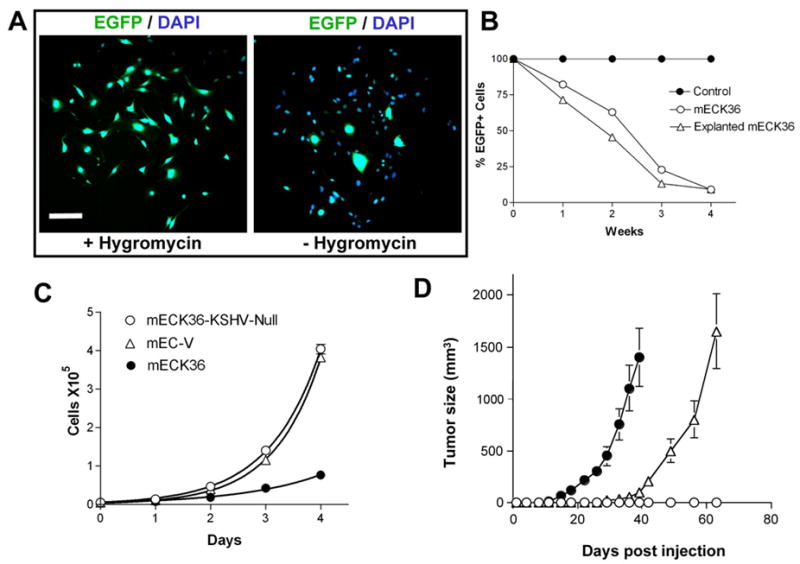
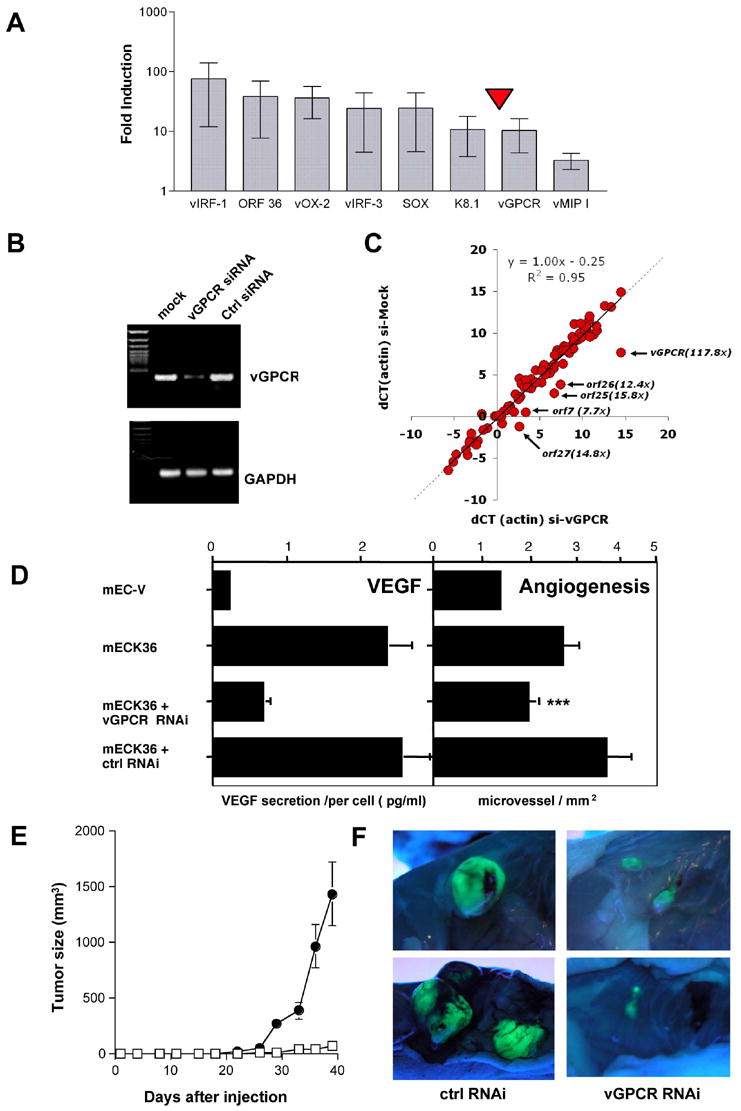
Transfection of a Kaposi's sarcoma (KS) herpesvirus (KSHV) Bacterial Artificial Chromosome (KSHVBac36) into mouse bone marrow endothelial-lineage cells generates a cell (mECK36) that forms KS-like tumors in mice. mECK36 expressed most KSHV genes and were angiogenic, but they didn't form colonies in soft agar. In nude mice, mECK36 formed KSHV-harboring vascularized spindle cell sarcomas that were LANA+/podoplanin+, overexpressed VEGF and Angiopoietin ligands and receptors, and displayed KSHV and host transcriptomes reminiscent of KS. mECK36 that lost the KSHV episome reverted to nontumorigenicity. siRNA suppression of KSHV vGPCR, an angiogenic gene upregulated in mECK36 tumors, inhibited angiogenicity and tumorigenicity. These results show that KSHV malignancy is in vivo growth restricted and reversible, defining mECK36 as a biologically sensitive animal model of KSHV-dependent KS.
Figures


Similar articles
-
A role for virally induced reactive oxygen species in Kaposi's sarcoma herpesvirus tumorigenesis.Antioxid Redox Signal. 2013 Jan 1;18(1):80-90. doi: 10.1089/ars.2012.4584. Epub 2012 Aug 20. Antioxid Redox Signal. 2013. PMID: 22746102 Free PMC article.
-
KSHV induces aerobic glycolysis and angiogenesis through HIF-1-dependent upregulation of pyruvate kinase 2 in Kaposi's sarcoma.Angiogenesis. 2015 Oct;18(4):477-88. doi: 10.1007/s10456-015-9475-4. Epub 2015 Jun 20. Angiogenesis. 2015. PMID: 26092770 Free PMC article.
-
G-protein-coupled receptor of Kaposi's sarcoma-associated herpesvirus is a viral oncogene and angiogenesis activator.Nature. 1998 Jan 1;391(6662):86-9. doi: 10.1038/34193. Nature. 1998. PMID: 9422510
-
Manipulation of endothelial cells by KSHV: implications for angiogenesis and aberrant vascular differentiation.Semin Cancer Biol. 2014 Jun;26:69-77. doi: 10.1016/j.semcancer.2014.01.008. Epub 2014 Jan 28. Semin Cancer Biol. 2014. PMID: 24486643 Review.
-
Initiation of angiogenic Kaposi's sarcoma lesions.Cancer Cell. 2003 Jan;3(1):1-3. doi: 10.1016/s1535-6108(03)00002-3. Cancer Cell. 2003. PMID: 12559168 Review.
Cited by
-
A role for virally induced reactive oxygen species in Kaposi's sarcoma herpesvirus tumorigenesis.Antioxid Redox Signal. 2013 Jan 1;18(1):80-90. doi: 10.1089/ars.2012.4584. Epub 2012 Aug 20. Antioxid Redox Signal. 2013. PMID: 22746102 Free PMC article.
-
The guanine exchange factor SWAP70 mediates vGPCR-induced endothelial plasticity.Cell Commun Signal. 2015 Feb 15;13:11. doi: 10.1186/s12964-015-0090-1. Cell Commun Signal. 2015. PMID: 25889342 Free PMC article.
-
A CreER-based random induction strategy for modeling translocation-associated sarcomas in mice.Cancer Res. 2009 Apr 15;69(8):3657-64. doi: 10.1158/0008-5472.CAN-08-4127. Epub 2009 Apr 7. Cancer Res. 2009. PMID: 19351831 Free PMC article.
-
Keeping it quiet: chromatin control of gammaherpesvirus latency.Nat Rev Microbiol. 2013 Dec;11(12):863-75. doi: 10.1038/nrmicro3135. Epub 2013 Nov 6. Nat Rev Microbiol. 2013. PMID: 24192651 Free PMC article. Review.
-
Systemic expression of Kaposi sarcoma herpesvirus (KSHV) Vflip in endothelial cells leads to a profound proinflammatory phenotype and myeloid lineage remodeling in vivo.PLoS Pathog. 2015 Jan 21;11(1):e1004581. doi: 10.1371/journal.ppat.1004581. eCollection 2015 Jan. PLoS Pathog. 2015. PMID: 25607954 Free PMC article.
References
-
- Aluigi MG, Albini A, Carlone S, Repetto L, De Marchi R, Icardi A, Moro M, Noonan D, Benelli R. KSHV sequences in biopsies and cultured spindle cells of epidemic, iatrogenic and Mediterranean forms of Kaposi's sarcoma. Res Virol. 1996;147:267–275. - PubMed
-
- Aoki Y, Jaffe ES, Chang Y, Jones K, Teruya-Feldstein J, Moore PS, Tosato G. Angiogenesis and hematopoiesis induced by Kaposi's sarcoma-associated herpesvirus-encoded interleukin-6 [see comments] Blood. 1999;93:4034–4043. - PubMed
-
- Auerbach R, Akhtar N, Lewis RL, Shinners BL. Angiogenesis assays: problems and pitfalls. Cancer & Metastasis Reviews. 2000;19:167–172. - PubMed
-
- Bais C, Santomasso B, Coso O, Arvanitakis L, Raaka EG, Gutkind JS, Asch AS, Cesarman E, Gershengorn MC, Mesri EA. G-protein-coupled receptor of Kaposi's sarcoma-associated herpesvirus is a viral oncogene and angiogenesis activator. Nature. 1998;391:86–89. - PubMed
Publication types
MeSH terms
Substances
Associated data
- Actions
Grants and funding
- R01 CA109232/CA/NCI NIH HHS/United States
- R01 CA163217/CA/NCI NIH HHS/United States
- R01 CA096512/CA/NCI NIH HHS/United States
- R01 DE018304-03/DE/NIDCR NIH HHS/United States
- R01 CA124332/CA/NCI NIH HHS/United States
- R01 DE018304/DE/NIDCR NIH HHS/United States
- CA096512/CA/NCI NIH HHS/United States
- CA110136/CA/NCI NIH HHS/United States
- CA109232/CA/NCI NIH HHS/United States
- R01 CA109232-05/CA/NCI NIH HHS/United States
- R01 DE018304-02/DE/NIDCR NIH HHS/United States
- R01 CA132637/CA/NCI NIH HHS/United States
- R01 CA075918/CA/NCI NIH HHS/United States
- R01 DE018304-01/DE/NIDCR NIH HHS/United States
- R03 CA110136/CA/NCI NIH HHS/United States
- CA075918/CA/NCI NIH HHS/United States
LinkOut - more resources
Full Text Sources
Other Literature Sources
Medical
Molecular Biology Databases
