. 2007 Apr;27(8):2952-66.
doi: 10.1128/MCB.01804-06. Epub 2007 Feb 5.

Methylation-controlled J protein promotes c-Jun degradation to prevent ABCB1 transporter expression

Affiliations

Methylation-controlled J protein promotes c-Jun degradation to prevent ABCB1 transporter expression

Ketki M Hatle et al. Mol Cell Biol. 2007 Apr.

Abstract

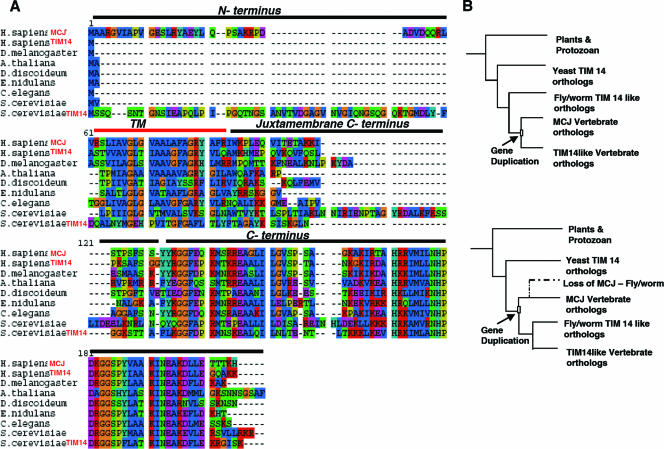
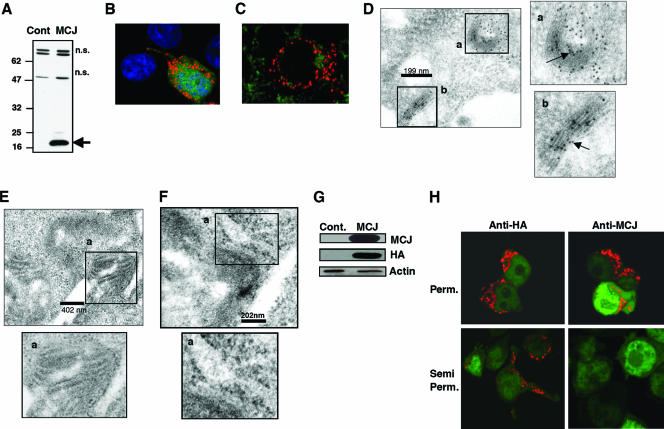
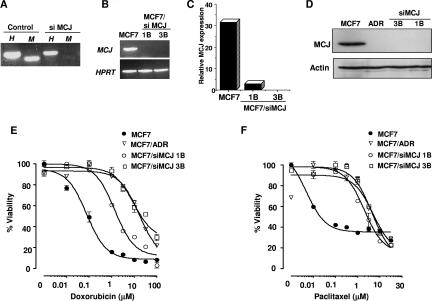
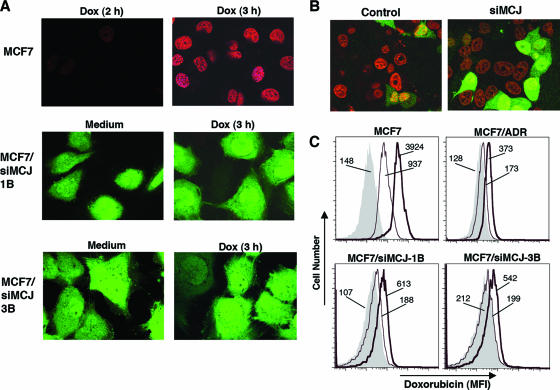
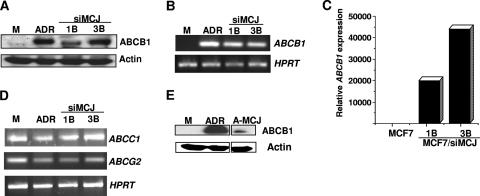
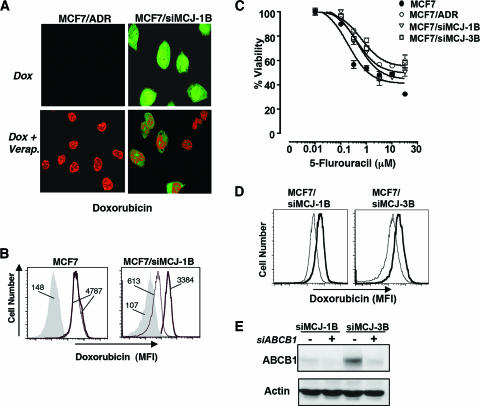
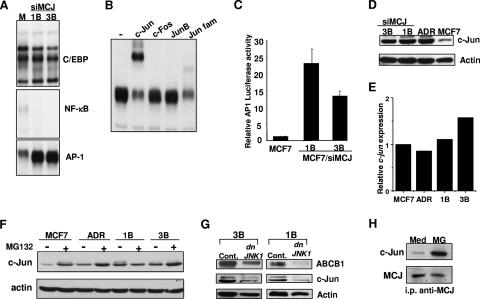
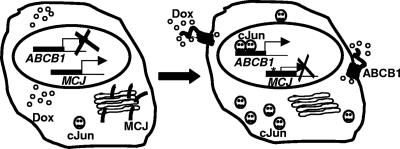
Methylation-controlled J protein (MCJ) is a newly identified member of the DnaJ family of cochaperones. Hypermethylation-mediated transcriptional silencing of the MCJ gene has been associated with increased chemotherapeutic resistance in ovarian cancer. However, the biology and function of MCJ remain unknown. Here we show that MCJ is a type II transmembrane cochaperone localized in the Golgi network and present only in vertebrates. MCJ is expressed in drug-sensitive breast cancer cells but not in multidrug-resistant cells. The inhibition of MCJ expression increases resistance to specific drugs by inducing expression of the ABCB1 drug transporter that prevents intracellular drug accumulation. The induction of ABCB1 gene expression is mediated by increased levels of c-Jun due to an impaired degradation of this transcription factor in the absence of MCJ. Thus, MCJ is required in these cells to prevent c-Jun-mediated expression of ABCB1 and maintain drug response.


Figures

FIG. 1.
FIG. 1.
Phylogenetic analysis and sequence alignment of MCJ. (A) Homologous MCJ sequences from different species found by a BLASTp search. Alignments were made using the T-Coffee program. H. sapiens, Homo sapiens; D. melanogaster, Drosophila melanogaster; A. thaliana, Arabidopsis thaliana; D. discoideum, Dictyostelium discoideum; E. nidulans, Emericella nidulans; C. elegans, Caenorhabditis elegans; S. cerevisiae, Saccharomyces cerevisiae. (B) Possible scenarios for the gene duplication event that resulted in the evolution of MCJ in vertebrates. The models for gene duplication after the divergence of the fly-worm TIM14-like clade from the vertebrates (top panel) and gene duplication prior to the divergence of the fly-worm TIM14-like clade from the vertebrate clades with subsequent possible gene loss in the fly-worm lineage (bottom panel) are shown.
FIG. 2.
FIG. 2.
Localization of MCJ in the Golgi apparatus. (A) 293T cells were transfected with a plasmid expressing HA-tagged MCJ (MCJ) or an empty plasmid (Cont). Whole-cell extracts were examined for MCJ expression by Western blot analysis using an anti-HA mAb. MCJ is indicated with an arrow (n.s., nonspecific). Numbers on the left are molecular size markers. (B) 293T cells were transfected with an MCJ-expressing plasmid. Transfected cells were fixed, permeabilized, and stained. The MCJ intracellular distribution was examined by confocal microscopy. MCJ (red), EGFP (green), and TOPRO-3 nuclear stain (blue) are shown. (C) MCJ-transfected 293T cells were stained for MCJ (red) and Mitotracker (green; Molecular Probes). (D, E, and F) MCJ-transfected 293T cells were fixed and used to examine MCJ localization by immunoelectron microscopy. The presence of MCJ is shown by black immunodense particles (arrows). Scale bars are given for each set of panels. Areas in the micrographs that include the Golgi apparatus (D), mitochondria (E), and endoplasmic reticulum (F) are presented. The insets (a and b) show the specific organelles and have been magnified (side and bottom panels) for better resolution. (G) 293T cells were transfected with an MCJ-expressing plasmid (MCJ) or an empty plasmid (Cont). Whole-cell extracts were examined for MCJ expression by Western blotting using an anti-MCJ polyclonal antibody, an anti-HA antibody, and an antiactin antibody as a loading control. (H) 293T cells were transfected with a plasmid containing HA-tagged MCJ and EGFP. Either complete permeabilization with Triton X-100 (Perm.) or semipermeabilization with a rapid freeze-thaw procedure (Semi Perm.) was done, followed by fixation and staining with anti-HA or anti-MCJ antibody. The EGFP-positive (green) cells are the transfected cells.
FIG. 3.
FIG. 3.
Loss of MCJ gene expression in multidrug-resistant breast cancer cells. (A) Total RNA was extracted from MCF7 and MCF7/ADR breast cancer cells and examined for the expression of MCJ and HPRT genes by RT-PCR. (B) The expression of the MCJ gene relative to that of the HPRT gene in MCF7 and MCF7/ADR cells was examined by quantitative real-time RT-PCR. (C) Total RNA was extracted from MCF7 and MCF7/IL-6 cells and examined for the expression of MCJ and HPRT genes by RT-PCR. (D) Total RNA was extracted from MCF7 cells cultured for 8 days in medium alone or in the presence of IL-6 (50 ng/ml). MCJ and HPRT gene expression was examined by RT-PCR. (E) MCF7 cells were cultured as described in the legend to panel D, and MCJ gene expression relative to that of HPRT was analyzed by real-time RT-PCR. (F and G) Total RNA was extracted from MDA-MB-321 (MDA) and MD22 breast cancer cells (F) and uterine cancer cells MES-SA (MES) and MES-SA/Dx5 (MES/Dx) (G) and examined for the expression of MCJ and HPRT genes by RT-PCR.
FIG. 4.
FIG. 4.
Loss of MCJ in multidrug-resistant breast cancer cells. (A) 293T cells were transfected with an MCJ-expressing plasmid (MCJ) or a control plasmid (Con) and lysed, and MCJ expression was determined by Western blot analysis using an anti-MCJ mAb (MCJ). Actin was examined as a loading control. (B) 293T cells were transfected with MCJ-expressing (MCJ) or control plasmids, fixed, stained using an anti-MCJ mAb (red), and examined by confocal microscopy. TOPRO (blue) was used as a nuclear dye. EGFP (green) denotes the transfected cells. The middle panel is a magnification (zoom) of a section of the upper panel. (C) MCJ expression in MCF7, MCF7/ADR (ADR), MCF7/IL-6 (M/IL-6), MDA-MB-321 (MDA), and MD22 cells was examined by Western blotting using whole-cell extracts and the anti-MCJ mAb (MCJ). Actin was used as a loading marker. (D) MCF7 and MCF7/ADR cells were fixed, stained with the anti-MCJ mAb (MCJ; red) or secondary antibody (control), and examined by confocal microscopy. TOPRO was used as a nuclear dye (blue). Magnified images of the anti-MCJ-stained MCF7 and MCF7/ADR cells are shown in the middle panels. (E) MCF7 cells were stained with a mouse anti-MCJ mAb and a rabbit anti-TGN46 antibody. TOPRO was used as a nuclear dye. Images show only MCJ staining (red), TGN46 staining (green), and the staining of both MCJ and TGN46 (MCJ+TGN) for the visualization of colocalization (orange).
FIG. 5.
FIG. 5.
MCJ is required for breast cancer cells to maintain a chemotherapy response. (A) MCF7 cells were transfected with the empty pSuperEGFP (control) or pSuperEGFP-siMCJ (siMCJ) plasmid. Total RNA was extracted 36 h after transfection, and MCJ (M) and HPRT (H) gene expression was examined by RT-PCR. (B) Total RNA from MCF7, MCF7/siMCJ-1B, and MCF7/siMCJ-3B cells was extracted and used to examine MCJ and HPRT gene expression by RT-PCR. (C) Total RNA isolated as described in the legend to panel B was used to examine MCJ gene expression relative to that of HPRT by real-time RT-PCR analysis. (D) Endogenous MCJ expression was examined by Western blot analysis. Whole-cell extracts from MCF7, MCF7/ADR (ADR), and MCF7/siMCJ (siMCJ)-1B and -3B cells were examined for MCJ with the anti-MCJ mAb. Actin expression was examined as a loading control. (E and F) Cell viability was determined by the MTT assay. LD50 were calculated by nonlinear regression. (E) LD50 of doxorubicin were 0.078 μM (MCF7), 16.60 μM (MCF7/ADR), 1.35 μM (MCF7/siMCJ-1B), and 9.29 μM (MCF7/siMCJ-3B). (F) LD50 of paclitaxel were 0.05 μM (MCF7), 4.5 μM (MCF7/ADR), 2.0 μM (MCF7/siMCJ-1B), and 4.99 μM (MCF7/siMCJ-3B). Results representative of those from four individual experiments are shown.
FIG. 6.
FIG. 6.
MCJ is required for the intracellular accumulation of doxorubicin. (A) MCF7, MCF7/siMCJ-1B, and MCF7/siMCJ-3B cells were incubated in the absence (medium) or the presence (Dox) of doxorubicin (3 μM) for the indicated periods of time. Doxorubicin (red) intracellular accumulation was detected by confocal microscopy. MCF7/siMCJ-1B and -3B cells expressed EGFP (green). (B) MCF7 cells were transiently transfected with the empty pSuperEGFP plasmid (control) or the pSuperEGFP-siMCJ plasmid (siMCJ). Thirty-six hours after the transfection, cells were treated with doxorubicin for 3 h and its intracellular accumulation (red) in untransfected (EGFP-negative) and transfected (EGFP-positive) cells was examined by confocal microscopy. (C) MCF7, MCF7/ADR, MCF7/siMCJ-1B, and MCF7/siMCJ-3B cells were treated with medium alone (gray-filled profiles) or with doxorubicin at 0.3 μM (thin-line profiles) or 3 μM (thick-line profiles) for 3 h. Doxorubicin intracellular accumulation was examined by flow cytometry. Numbers represent the mean fluorescence intensities (MFI) of doxorubicin.
FIG. 7.
FIG. 7.
MCJ suppresses ABCB1 gene expression. (A) Whole-cell extracts from MCF7 (M), MCF7/ADR (ADR), and MCF7/siMCJ (siMCJ)-1B and -3B cells were used to examine ABCB1 expression by Western blot analysis. Actin was also examined as a loading control. (B) Total RNA extracted from MCF7 (M), MCF7/ADR (ADR), and MCF7/siMCJ-1B (siMCJ 1B) and -3B cells was used to examine ABCB1 and HPRT gene expression by RT-PCR. (C) Quantitative real-time RT-PCR analysis of ABCB1 gene expression relative to that of HPRT in MCF7 and MCF7/siMCJ-1B and -3B cells. (D) Total RNA was extracted from MCF7 (M), MCF7/ADR (ADR), and MCF7/siMCJ-1B (siMCJ 1B) and -3B cells and used to examine ABCC1, ABCG2, and HPRT gene expression by RT-PCR. (E) Whole-cell extracts from MCF7 (M), MCF7/ADR (ADR), and MCF7/ADR-MCJ (A-MCJ) cells were used to examine ABCB1 expression by Western blot analysis. Actin expression was examined as a loading control.
FIG. 8.
FIG. 8.
Multidrug resistance induced by the loss of MCJ expression is mediated by ABCB1. (A) MCF7/ADR and MCF7/siMCJ-1B cells (green) were treated with doxorubicin (3 μM) for 3 h in the absence (Dox) or the presence (Dox + Verap.) of the ABCB1 inhibitor verapamil (10 μM). The intracellular accumulation of doxorubicin fluorescence (red) was examined by confocal microscopy. EGFP expression (green) in MCF7/siMCJ-1B cells is also presented. (B) MCF7 and MCF7/siMCJ-1B cells were treated with medium alone (gray-filled profiles) or with 3 μM of doxorubicin (3 h) in the absence (thin-line profiles) or the presence (thick-line profiles) of verapamil (10 μM). The numbers represent mean fluorescence intensities (MFI) of doxorubicin. (C) MCF7, MCF7/ADR, MCF7/siMCJ-1B, and MCF7/siMCJ-3B cells were plated and treated in the absence or presence of different concentrations of 5-FU. Cell viability was determined by the MTT assay. LD50s of 5-FU were 0.94 μM (MCF7), 2.34 μM (MCF7/ADR), 1.93 μM (MCF7/siMCJ-1B), and 1.71 μM (MCF7/siMCJ-3B). (D) MCF7/siMCJ-1B and -3B cells were transfected in the presence (thick line) or absence (thin line) of siRNA oligonucleotides corresponding to ABCB1. After 48 h, cells were treated with doxorubicin and the intracellular drug accumulation was examined by flow cytometry. (E) MCF7/siMCJ-1B (siMCJ 1B) and -3B cells were transfected as described in the legend to panel D, and after 48 h, cells were lysed to examine the levels of ABCB1 by Western blot analysis. siABCB1, siRNA oligonucleotides corresponding to ABCB1; −, absence; +, presence.
FIG. 9.
FIG. 9.
MCJ downregulates ABCB1 expression by modulation of the AP-1 transcription factor. (A) Nuclear extracts from MCF7 (M) and MCF7/siMCJ (siMCJ)-1B and -3B cells were examined by EMSA using 32P-labeled double-stranded oligonucleotides specific for the C/EBP, NF-κB, and AP-1 genes. (B) AP-1 DNA binding was examined by EMSA using nuclear extracts from MCF7/siMCJ-1B cells and an AP-1 oligonucleotide. Binding reactions were performed in the absence (−) or presence of an anti-c-Jun, c-Fos, JunB, or Jun family (Jun fam.) antibody. (C) MCF7, MCF7/siMCJ-1B, and MCF7/siMCJ-3B cells were cotransfected with an AP-1-luciferase reporter construct and a β-Gal-expressing plasmid. After 24 h, luciferase values were measured and normalized to β-Gal activity as a control for the efficiency of the transfection. The error bars represent standard errors of the means (n = 3). (D) Whole-cell extracts from MCF7/siMCJ (siMCJ)-3B and -1B, MCF7/ADR (ADR), and MCF7 cells were analyzed for c-Jun expression by Western blot analysis. Actin was used as a loading control. (E) Total RNA isolated from MCF7/siMCJ-3B (3B) and -1B (1B), MCF7/ADR (ADR), and MCF7 cells was used to examine c-jun mRNA levels relative to levels of HPRT mRNA by real-time RT-PCR. (F) Whole-cell lysates from MCF7, MCF7/ADR (ADR), and MCF7/siMCJ-1B (1B) and -3B (3B) cells were treated in the absence (−) or presence (+) of proteasome inhibitor MG132 (5 μM) for 4 h and analyzed for c-Jun expression by Western blot analysis. (G) MCF7/siMCJ-3B (3B) and -1B (1B) cells were transfected with the empty control plasmid (Cont) or the dnJNK1 plasmid. Whole-cell lysates were analyzed for ABCB1, actin, and c-Jun by Western blotting. (H) MCF7 cells were treated with medium (Med) or MG132 (MG) for 4 h and lysed, and whole-cell extracts were used to immunoprecipitate MCJ (i.p. anti-MCJ). MCJ immunoprecipitates were examined for c-Jun by Western blot analysis using an anti-c-Jun antibody (c-Jun). The blot was further reprobed with the anti-MCJ mAb (MCJ).
FIG. 10.
FIG. 10.
Model representing MCJ in the Golgi network, associating with c-Jun and preventing its accumulation and inhibiting ABCB1 expression, allowing the intracellular accumulation of doxorubicin (Dox). In the absence of MCJ, increased levels of c-Jun upregulate ABCB1 gene expression. Doxorubicin is flushed out of the cell by the ABCB1 protein.

Similar articles

Cited by

References

    1. Alley, M., D. Scudiero, A. Monks, M. Hursey, M. Czerwinski, D. Fine, B. Abbott, J. Mayo, R. Shoemaker, and M. Boyd. 1988. Feasibility of drug screening with panels of human tumor cell lines using a microculture tetrazolium assay. Cancer Res. 48:589-601. - PubMed
    1. Altschul, S. F., W. Gish, W. Miller, E. W. Myers, and D. J. Lipman. 1990. Basic local alignment search tool. J. Mol. Biol. 215:403-410. - PubMed
    1. Altschul, S. F., T. L. Madden, A. A. Schaffer, J. Zhang, Z. Zhang, W. Miller, and D. J. Lipman. 1997. Gapped BLAST and PSI-BLAST: a new generation of protein database search programs. Nucleic Acids Res. 25:3389-3402. - PMC - PubMed
    1. Angel, P., M. Imagawa, R. Chiu, B. Stein, R. J. Imbra, H. J. Rahmsdorf, C. Jonat, P. Herrlich, and M. Karin. 1987. Phorbol ester-inducible genes contain a common cis element recognized by a TPA-modulated trans-acting factor. Cell 49:729-739. - PubMed
    1. Belhoussine, R., H. Morjani, S. Sharonov, D. Ploton, and M. Manfait. 1999. Characterization of intracellular pH gradients in human multidrug-resistant tumor cells by means of scanning microspectrofluorometry and dual-emission-ratio probes. Int. J. Cancer 81:81-89. - PubMed

Publication types

MeSH terms

Substances

LinkOut - more resources