Functional p53 signaling in Kaposi's sarcoma-associated herpesvirus lymphomas: implications for therapy
- PMID: 17121789
- PMCID: PMC1797584
- DOI: 10.1128/JVI.01757-06
Functional p53 signaling in Kaposi's sarcoma-associated herpesvirus lymphomas: implications for therapy
Abstract
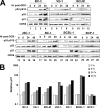
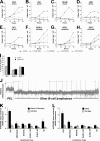
The Kaposi's sarcoma-associated herpesvirus (KSHV/HHV8) is associated with Kaposi's sarcoma (KS) as well as primary effusion lymphomas (PEL). The expression of viral proteins capable of inactivating the p53 tumor suppressor protein has been implicated in KSHV oncogenesis. However, DNA-damaging drugs such as doxorubicin are clinically efficacious against PEL and KS, suggesting that p53 signaling remains intact despite the presence of KSHV. To investigate the functionality of p53 in PEL, we examined the response of a large number of PEL cell lines to doxorubicin. Two out of seven (29%) PEL cell lines harbored a mutant p53 allele (BCBL-1 and BCP-1) which led to doxorubicin resistance. In contrast, all other PEL containing wild-type p53 showed DNA damage-induced cell cycle arrest, p53 phosphorylation, and p53 target gene activation. These data imply that p53-mediated DNA damage signaling was intact. Supporting this finding, chemical inhibition of p53 signaling in PEL led to doxorubicin resistance, and chemical activation of p53 by the Hdm2 antagonist Nutlin-3 led to unimpaired induction of p53 target genes as well as growth inhibition and apoptosis.
Figures


Similar articles
-
Kaposi's Sarcoma-Associated Herpesvirus MicroRNAs Target GADD45B To Protect Infected Cells from Cell Cycle Arrest and Apoptosis.J Virol. 2017 Jan 18;91(3):e02045-16. doi: 10.1128/JVI.02045-16. Print 2017 Feb 1. J Virol. 2017. PMID: 27852859 Free PMC article.
-
Reactivation of the p53 pathway as a treatment modality for KSHV-induced lymphomas.J Clin Invest. 2007 Apr;117(4):1019-28. doi: 10.1172/JCI30945. Epub 2007 Mar 15. J Clin Invest. 2007. PMID: 17364023 Free PMC article.
-
Recruitment of the tumour suppressor protein p73 by Kaposi's Sarcoma Herpesvirus latent nuclear antigen contributes to the survival of primary effusion lymphoma cells.Oncogene. 2013 Aug 8;32(32):3676-85. doi: 10.1038/onc.2012.385. Epub 2012 Sep 10. Oncogene. 2013. PMID: 22964633
-
p53 reactivation kills KSHV lymphomas efficiently in vitro and in vivo: new hope for treating aggressive viral lymphomas.Cell Cycle. 2007 Sep 15;6(18):2205-9. doi: 10.4161/cc.6.18.4730. Epub 2007 Jul 10. Cell Cycle. 2007. PMID: 17890905 Review.
-
KSHV/HHV8-associated lymphomas.Br J Haematol. 2008 Jan;140(1):13-24. doi: 10.1111/j.1365-2141.2007.06879.x. Epub 2007 Nov 7. Br J Haematol. 2008. PMID: 17991301 Review.
Cited by
-
Distinct p53, p53:LANA, and LANA complexes in Kaposi's Sarcoma--associated Herpesvirus Lymphomas.J Virol. 2010 Apr;84(8):3898-908. doi: 10.1128/JVI.01321-09. Epub 2010 Feb 3. J Virol. 2010. PMID: 20130056 Free PMC article.
-
Old plasma dilution reduces human biological age: a clinical study.Geroscience. 2022 Dec;44(6):2701-2720. doi: 10.1007/s11357-022-00645-w. Epub 2022 Aug 24. Geroscience. 2022. PMID: 35999337 Free PMC article.
-
Role of Kaposi's sarcoma-associated herpesvirus C-terminal LANA chromosome binding in episome persistence.J Virol. 2009 May;83(9):4326-37. doi: 10.1128/JVI.02395-08. Epub 2009 Feb 18. J Virol. 2009. PMID: 19225000 Free PMC article.
-
Phosphatase and tensin homolog on chromosome 10 is phosphorylated in primary effusion lymphoma and Kaposi's sarcoma.Am J Pathol. 2011 Oct;179(4):2108-19. doi: 10.1016/j.ajpath.2011.06.017. Epub 2011 Aug 3. Am J Pathol. 2011. PMID: 21819957 Free PMC article.
-
Cell Cycle Regulatory Functions of the KSHV Oncoprotein LANA.Front Microbiol. 2016 Mar 30;7:334. doi: 10.3389/fmicb.2016.00334. eCollection 2016. Front Microbiol. 2016. PMID: 27065950 Free PMC article. Review.
References
-
- Ansari, M. Q., D. B. Dawson, R. Nador, C. Rutherford, N. R. Schneider, M. J. Latimer, L. Picker, D. M. Knowles, and R. W. McKenna. 1996. Primary body cavity-based AIDS-related lymphomas. Am. J. Clin. Pathol. 105:221-229. - PubMed
-
- Arvanitakis, L., E. A. Mesri, R. G. Nador, J. W. Said, A. S. Asch, D. M. Knowles, and E. Cesarman. 1996. Establishment and characterization of a primary effusion (body cavity-based) lymphoma cell line (BC-3) harboring Kaposi's sarcoma-associated herpesvirus (KSHV/HHV-8) in the absence of Epstein-Barr virus. Blood 88:2648-2654. - PubMed
-
- Banin, S., L. Moyal, S. Shieh, Y. Taya, C. W. Anderson, L. Chessa, N. I. Smorodinsky, C. Prives, Y. Reiss, Y. Shiloh, and Y. Ziv. 1998. Enhanced phosphorylation of p53 by ATM in response to DNA damage. Science 281:1674-1677. - PubMed
-
- Barbera, A. J., J. V. Chodaparambil, B. Kelley-Clarke, V. Joukov, J. C. Walter, K. Luger, and K. M. Kaye. 2006. The nucleosomal surface as a docking station for Kaposi's sarcoma herpesvirus LANA. Science 311:856-861. - PubMed
-
- Boshoff, C., S. J. Gao, L. E. Healy, S. Matthews, A. J. Thomas, L. Coignet, R. A. Warnke, J. A. Strauchen, E. Matutes, O. W. Kamel, P. S. Moore, R. A. Weiss, and Y. Chang. 1998. Establishing a KSHV+ cell line (BCP-1) from peripheral blood and characterizing its growth in Nod/SCID mice. Blood 91:1671-1679. - PubMed
Publication types
MeSH terms
Substances
Grants and funding
- R01 CA109232/CA/NCI NIH HHS/United States
- R01 CA163217/CA/NCI NIH HHS/United States
- R01 CA109232-02/CA/NCI NIH HHS/United States
- T32 CA009156/CA/NCI NIH HHS/United States
- CA009156/CA/NCI NIH HHS/United States
- CA700580/CA/NCI NIH HHS/United States
- R01 CA109232-01/CA/NCI NIH HHS/United States
- R01 DE018304/DE/NIDCR NIH HHS/United States
- R01 CA109232-03S1/CA/NCI NIH HHS/United States
- CA109232/CA/NCI NIH HHS/United States
- R01 CA109232-05/CA/NCI NIH HHS/United States
- R01 CA109232-04/CA/NCI NIH HHS/United States
- R01 CA109232-03/CA/NCI NIH HHS/United States
LinkOut - more resources
Full Text Sources
Other Literature Sources
Medical
Research Materials
Miscellaneous

