

Rapamycin is efficacious against primary effusion lymphoma (PEL) cell lines in vivo by inhibiting autocrine signaling
- PMID: 17082322
- PMCID: PMC1801055
- DOI: 10.1182/blood-2006-06-028092
Rapamycin is efficacious against primary effusion lymphoma (PEL) cell lines in vivo by inhibiting autocrine signaling
Abstract
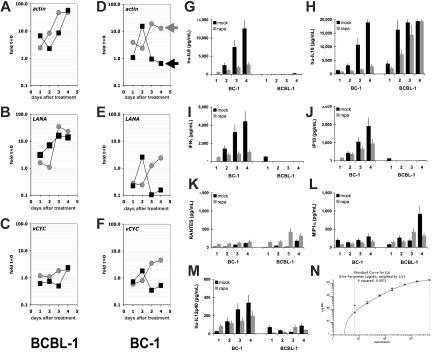
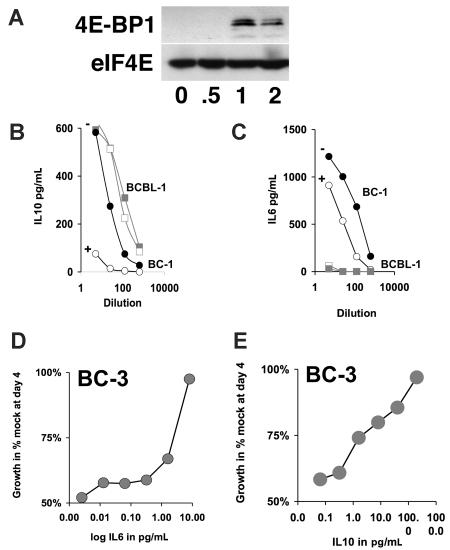
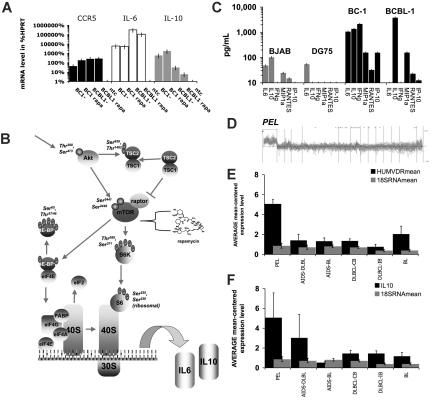
The antitumor potency of the mTOR inhibitor rapamycin (sirolimus) is the subject of intense investigations. Primary effusion lymphoma (PEL) appears as an AIDS-defining lymphoma and like Kaposi sarcoma has been linked to Kaposi sarcoma-associated herpesvirus (KSHV). We find that (1) rapamycin is efficacious against PEL in culture and in a murine xenograft model; (2) mTOR, its activator Akt, and its target p70S6 kinase are phosphorylated in PEL; (3) rapamycin inhibits mTOR signaling as determined by S6 phosphorylation; (4) KSHV transcription is unaffected; (5) inhibition of IL-10 signaling correlates with drug sensitivity; and (6) addition of exogenous IL-10 or IL-6 can reverse the rapamycin growth arrest. This validates sirolimus as a new treatment option for PEL.
Figures


Similar articles
-
Depressing time: Waiting, melancholia, and the psychoanalytic practice of care.In: Kirtsoglou E, Simpson B, editors. The Time of Anthropology: Studies of Contemporary Chronopolitics. Abingdon: Routledge; 2020. Chapter 5. In: Kirtsoglou E, Simpson B, editors. The Time of Anthropology: Studies of Contemporary Chronopolitics. Abingdon: Routledge; 2020. Chapter 5. PMID: 36137063 Free Books & Documents. Review.
-
Australia in 2030: what is our path to health for all?Med J Aust. 2021 May;214 Suppl 8:S5-S40. doi: 10.5694/mja2.51020. Med J Aust. 2021. PMID: 33934362
-
Enabling Systemic Identification and Functionality Profiling for Cdc42 Homeostatic Modulators.bioRxiv [Preprint]. 2024 Jan 8:2024.01.05.574351. doi: 10.1101/2024.01.05.574351. bioRxiv. 2024. Update in: Commun Chem. 2024 Nov 19;7(1):271. doi: 10.1038/s42004-024-01352-7. PMID: 38260445 Free PMC article. Updated. Preprint.
-
Identification of a novel toxicophore in anti-cancer chemotherapeutics that targets mitochondrial respiratory complex I.Elife. 2020 May 20;9:e55845. doi: 10.7554/eLife.55845. Elife. 2020. PMID: 32432547 Free PMC article.
-
Metformin for endometrial hyperplasia.Cochrane Database Syst Rev. 2024 May 2;5(5):CD012214. doi: 10.1002/14651858.CD012214.pub3. Cochrane Database Syst Rev. 2024. PMID: 38695827 Review.
Cited by
-
Kaposi's Sarcoma-Associated Herpesvirus (KSHV)-Associated Disease in the AIDS Patient: An Update.Cancer Treat Res. 2019;177:63-80. doi: 10.1007/978-3-030-03502-0_3. Cancer Treat Res. 2019. PMID: 30523621 Free PMC article. Review.
-
Extracellular Hsp90 serves as a co-factor for MAPK activation and latent viral gene expression during de novo infection by KSHV.Virology. 2010 Jul 20;403(1):92-102. doi: 10.1016/j.virol.2010.03.052. Epub 2010 May 6. Virology. 2010. PMID: 20451233 Free PMC article.
-
Kaposi's Sarcoma-Associated Herpesvirus Lytic Replication Interferes with mTORC1 Regulation of Autophagy and Viral Protein Synthesis.J Virol. 2019 Oct 15;93(21):e00854-19. doi: 10.1128/JVI.00854-19. Print 2019 Nov 1. J Virol. 2019. PMID: 31375594 Free PMC article.
-
Extracellular vesicles from Kaposi Sarcoma-associated herpesvirus lymphoma induce long-term endothelial cell reprogramming.PLoS Pathog. 2019 Feb 4;15(2):e1007536. doi: 10.1371/journal.ppat.1007536. eCollection 2019 Feb. PLoS Pathog. 2019. PMID: 30716130 Free PMC article.
-
Current status of treatment for primary effusion lymphoma.Intractable Rare Dis Res. 2014 Aug;3(3):65-74. doi: 10.5582/irdr.2014.01010. Intractable Rare Dis Res. 2014. PMID: 25364646 Free PMC article. Review.
References
-
- Jones D, Ballestas ME, Kaye KM, et al. Primary-effusion lymphoma and Kaposi's sarcoma in a cardiac-transplant recipient. N Engl J Med. 1998;339:444–449. - PubMed
-
- Regamey N, Tamm M, Wernli M, et al. Transmission of human herpesvirus 8 infection from renal-transplant donors to recipients. N Engl J Med. 1998;339:1358–1363. - PubMed
-
- Farge D, Lebbe C, Marjanovic Z, et al. Human herpes virus-8 and other risk factors for Kaposi's sarcoma in kidney transplant recipients. Groupe Cooperatif de Transplantation d' Ile de France (GCIF). Transplantation. 1999;67:1236–1242. - PubMed
-
- Andreoni M, Goletti D, Pezzotti P, et al. Prevalence, incidence and correlates of HHV-8/KSHV infection and Kaposi's sarcoma in renal and liver transplant recipients. J Infect. 2001;43:195–199. - PubMed
-
- Barozzi P, Luppi M, Facchetti F, et al. Post-transplant Kaposi sarcoma originates from the seeding of donor-derived progenitors. Nat Med. 2003;9:554–561. - PubMed
Publication types
MeSH terms
Substances
Grants and funding
- HL083469/HL/NHLBI NIH HHS/United States
- R01 CA109232/CA/NCI NIH HHS/United States
- R01 CA163217/CA/NCI NIH HHS/United States
- R01 DE018304-03/DE/NIDCR NIH HHS/United States
- CA096500/CA/NCI NIH HHS/United States
- R01 DE018304/DE/NIDCR NIH HHS/United States
- AI057157/AI/NIAID NIH HHS/United States
- CA098110/CA/NCI NIH HHS/United States
- CA109232/CA/NCI NIH HHS/United States
- CA112935/CA/NCI NIH HHS/United States
- R01 CA098110/CA/NCI NIH HHS/United States
- R01 DE018304-02/DE/NIDCR NIH HHS/United States
- R01 HL083469/HL/NHLBI NIH HHS/United States
- R01 DE018304-01/DE/NIDCR NIH HHS/United States
- U54 AI057157/AI/NIAID NIH HHS/United States
- R01 CA096500/CA/NCI NIH HHS/United States
LinkOut - more resources
Full Text Sources
Other Literature Sources
Medical
Miscellaneous
