

KSHV targets multiple leukocyte lineages during long-term productive infection in NOD/SCID mice
- PMID: 16794734
- PMCID: PMC1481659
- DOI: 10.1172/JCI27249
KSHV targets multiple leukocyte lineages during long-term productive infection in NOD/SCID mice
Abstract
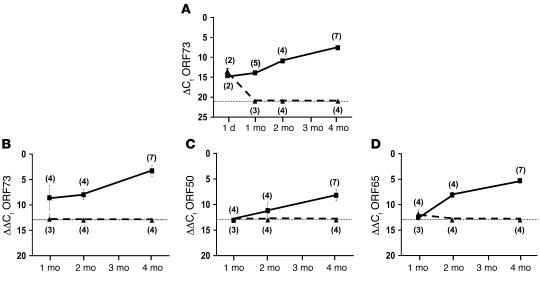
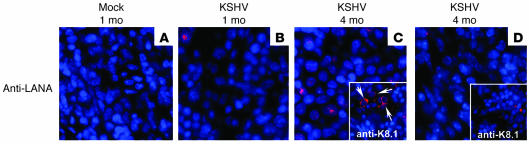
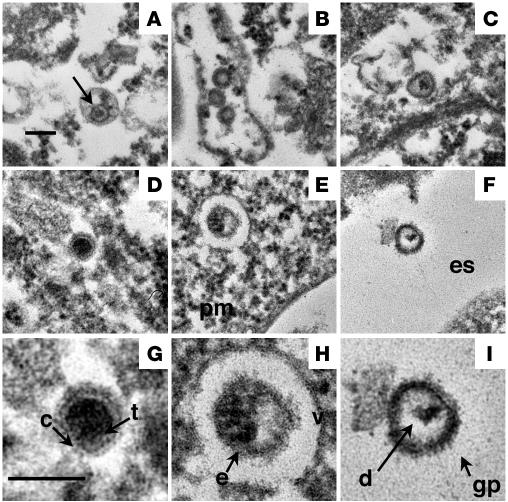
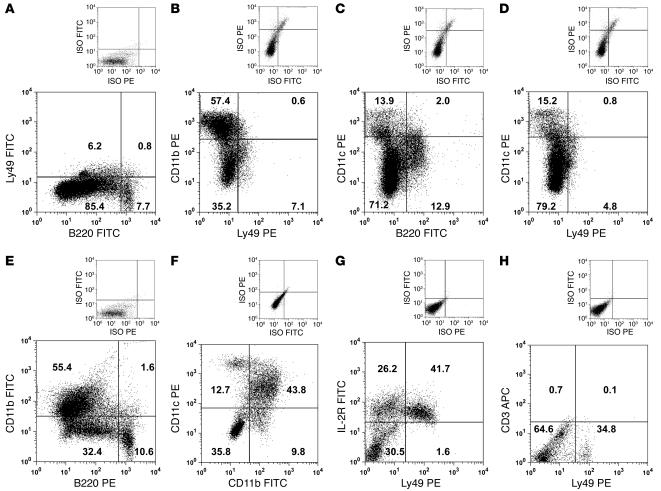
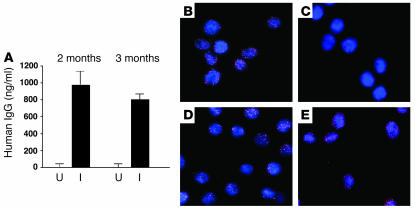
To develop an animal model of Kaposi sarcoma-associated herpesvirus (KSHV) infection uniquely suited to evaluate longitudinal patterns of viral gene expression, cell tropism, and immune responses, we injected NOD/SCID mice intravenously with purified virus and measured latent and lytic viral transcripts in distal organs over the subsequent 4 months. We observed sequential escalation of first latent and then lytic KSHV gene expression coupled with electron micrographic evidence of virion production within the murine spleen. Using novel technology that integrates flow cytometry with immunofluorescence microscopy, we found that the virus establishes infection in murine B cells, macrophages, NK cells, and, to a lesser extent, dendritic cells. To investigate the potential for human KSHV-specific immune responses within this immunocompromised host, we implanted NOD/SCID mice with functional human hematopoietic tissue grafts (NOD/SCID-hu mice) and observed that a subset of animals produced human KSHV-specific antibodies. Furthermore, treatment of these chimeric mice with ganciclovir at the time of inoculation led to prolonged but reversible suppression of KSHV DNA and RNA levels, suggesting that KSHV can establish latent infection in vivo despite ongoing suppression of lytic replication.
Figures


Similar articles
-
Repurposing Cytarabine for Treating Primary Effusion Lymphoma by Targeting Kaposi's Sarcoma-Associated Herpesvirus Latent and Lytic Replications.mBio. 2018 May 8;9(3):e00756-18. doi: 10.1128/mBio.00756-18. mBio. 2018. PMID: 29739902 Free PMC article.
-
KSHV/HHV-8 infection of human hematopoietic progenitor (CD34+) cells: persistence of infection during hematopoiesis in vitro and in vivo.Blood. 2006 Jul 1;108(1):141-51. doi: 10.1182/blood-2005-04-1697. Epub 2006 Mar 16. Blood. 2006. PMID: 16543476 Free PMC article.
-
Genipin Enhances Kaposi's Sarcoma-Associated Herpesvirus Genome Maintenance.PLoS One. 2016 Oct 13;11(10):e0163693. doi: 10.1371/journal.pone.0163693. eCollection 2016. PLoS One. 2016. PMID: 27736870 Free PMC article.
-
Viral latent proteins as targets for Kaposi's sarcoma and Kaposi's sarcoma-associated herpesvirus (KSHV/HHV-8) induced lymphoma.Curr Drug Targets Infect Disord. 2003 Jun;3(2):129-35. doi: 10.2174/1568005033481150. Curr Drug Targets Infect Disord. 2003. PMID: 12769790 Review.
-
Role of SUMOylation in Human Oncogenic Herpesvirus Infection.Virus Res. 2020 Jul 2;283:197962. doi: 10.1016/j.virusres.2020.197962. Epub 2020 Apr 11. Virus Res. 2020. PMID: 32283130 Review.
Cited by
-
Human immune responses and potential for vaccine assessment in humanized mice.Curr Opin Immunol. 2013 Jun;25(3):403-9. doi: 10.1016/j.coi.2013.03.009. Epub 2013 Apr 27. Curr Opin Immunol. 2013. PMID: 23628166 Free PMC article. Review.
-
Activity and mechanism of action of HDVD, a novel pyrimidine nucleoside derivative with high levels of selectivity and potency against gammaherpesviruses.J Virol. 2013 Apr;87(7):3839-51. doi: 10.1128/JVI.03338-12. Epub 2013 Jan 23. J Virol. 2013. PMID: 23345517 Free PMC article.
-
Kaposi's sarcoma and its associated herpesvirus.Nat Rev Cancer. 2010 Oct;10(10):707-19. doi: 10.1038/nrc2888. Nat Rev Cancer. 2010. PMID: 20865011 Free PMC article. Review.
-
KSHV infects a subset of human tonsillar B cells, driving proliferation and plasmablast differentiation.J Clin Invest. 2011 Feb;121(2):752-68. doi: 10.1172/JCI44185. Epub 2011 Jan 18. J Clin Invest. 2011. PMID: 21245574 Free PMC article.
-
KSHV targeted therapy: an update on inhibitors of viral lytic replication.Viruses. 2014 Nov 24;6(11):4731-59. doi: 10.3390/v6114731. Viruses. 2014. PMID: 25421895 Free PMC article. Review.
References
-
- Okano M., Gross T.G. A review of Epstein-Barr virus infection in patients with immunodeficiency disorders. Am. J. Med. Sci. 2000;319:392–396. - PubMed
-
- Boshoff C., Chang Y. Kaposi’s sarcoma-associated herpesvirus: a new DNA tumor virus. Annu. Rev. Med. 2001;52:453–470. - PubMed
-
- Gandhi M.K., Khanna R. Human cytomegalovirus: clinical aspects, immune regulation, and emerging treatments. Lancet Infect. Dis. 2004;4:725–738. - PubMed
-
- Cesarman E., Chang Y., Moore P.S., Said J.W., Knowles D.M. Kaposi’s sarcoma-associated herpesvirus-like DNA sequences in AIDS-related body-cavity-based lymphomas. N. Engl. J. Med. 1995;332:1186–1191. - PubMed
-
- Cesarman E., Knowles D.M. The role of Kaposi’s sarcoma-associated herpesvirus (KSHV/HHV-8) in lymphoproliferative diseases. Semin. Cancer Biol. 1999;9:165–174. - PubMed
Publication types
MeSH terms
Substances
Grants and funding
LinkOut - more resources
Full Text Sources
Other Literature Sources
