Long-term-infected telomerase-immortalized endothelial cells: a model for Kaposi's sarcoma-associated herpesvirus latency in vitro and in vivo
- PMID: 16641275
- PMCID: PMC1472065
- DOI: 10.1128/JVI.80.10.4833-4846.2006
Long-term-infected telomerase-immortalized endothelial cells: a model for Kaposi's sarcoma-associated herpesvirus latency in vitro and in vivo
Abstract
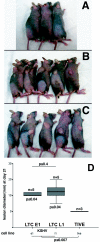
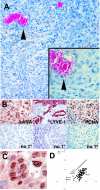
Kaposi's sarcoma-associated herpesvirus (KSHV) is associated with Kaposi's sarcoma (KS), primary effusion lymphoma (PEL), and multicentric Castleman's disease. Most KS tumor cells are latently infected with KSHV and are of endothelial origin. While PEL-derived cell lines maintain KSHV indefinitely, all KS tumor-derived cells to date have lost viral genomes upon ex vivo cultivation. To study KSHV latency and tumorigenesis in endothelial cells, we generated telomerase-immortalized human umbilical vein endothelial (TIVE) cells. TIVE cells express all KSHV latent genes 48 h postinfection, and productive lytic replication could be induced by RTA/Orf50. Similar to prior models, infected cultures gradually lost viral episomes. However, we also obtained, for the first time, two endothelial cell lines in which KSHV episomes were maintained indefinitely in the absence of selection. Long-term KSHV maintenance correlated with loss of reactivation in response to RTA/Orf50 and complete oncogenic transformation. Long-term-infected TIVE cells (LTC) grew in soft agar and proliferated under reduced-serum conditions. LTC, but not parental TIVE cells, formed tumors in nude mice. These tumors expressed high levels of the latency-associated nuclear antigen (LANA) and expressed lymphatic endothelial specific antigens as found in KS (LYVE-1). Furthermore, host genes, like those encoding interleukin 6, vascular endothelial growth factor, and basic fibroblast growth factor, known to be highly expressed in KS lesions were also induced in LTC-derived tumors. KSHV-infected LTCs represent the first xenograft model for KS and should be of use to study KS pathogenesis and for the validation of anti-KS drug candidates.
Figures


Similar articles
-
Reduction of Kaposi's Sarcoma-Associated Herpesvirus Latency Using CRISPR-Cas9 To Edit the Latency-Associated Nuclear Antigen Gene.J Virol. 2019 Mar 21;93(7):e02183-18. doi: 10.1128/JVI.02183-18. Print 2019 Apr 1. J Virol. 2019. PMID: 30651362 Free PMC article.
-
Kaposi's Sarcoma-Associated Herpesvirus Infection Induces the Expression of Neuroendocrine Genes in Endothelial Cells.J Virol. 2020 Mar 31;94(8):e01692-19. doi: 10.1128/JVI.01692-19. Print 2020 Mar 31. J Virol. 2020. PMID: 31969437 Free PMC article.
-
Kaposi's sarcoma associated herpes virus (KSHV) induced COX-2: a key factor in latency, inflammation, angiogenesis, cell survival and invasion.PLoS Pathog. 2010 Feb 12;6(2):e1000777. doi: 10.1371/journal.ppat.1000777. PLoS Pathog. 2010. PMID: 20169190 Free PMC article.
-
Regulation of KSHV Latency and Lytic Reactivation.Viruses. 2020 Sep 17;12(9):1034. doi: 10.3390/v12091034. Viruses. 2020. PMID: 32957532 Free PMC article. Review.
-
Cyclooxygenase-2-prostaglandin E2-eicosanoid receptor inflammatory axis: a key player in Kaposi's sarcoma-associated herpes virus associated malignancies.Transl Res. 2013 Aug;162(2):77-92. doi: 10.1016/j.trsl.2013.03.004. Epub 2013 Apr 6. Transl Res. 2013. PMID: 23567332 Free PMC article. Review.
Cited by
-
SIRT1-mediated downregulation of p27Kip1 is essential for overcoming contact inhibition of Kaposi's sarcoma-associated herpesvirus transformed cells.Oncotarget. 2016 Nov 15;7(46):75698-75711. doi: 10.18632/oncotarget.12359. Oncotarget. 2016. PMID: 27708228 Free PMC article.
-
An endothelial cell line infected by Kaposi's sarcoma-associated herpes virus (KSHV) allows the investigation of Kaposi's sarcoma and the validation of novel viral inhibitors in vitro and in vivo.J Mol Med (Berl). 2019 Mar;97(3):311-324. doi: 10.1007/s00109-018-01733-1. Epub 2019 Jan 4. J Mol Med (Berl). 2019. PMID: 30610257
-
Liposomal daunorubicin as treatment for Kaposi's sarcoma.Int J Nanomedicine. 2007;2(3):277-88. Int J Nanomedicine. 2007. PMID: 18019828 Free PMC article. Review.
-
The Kaposi's sarcoma-associated herpesvirus (KSHV)-induced 5-lipoxygenase-leukotriene B4 cascade plays key roles in KSHV latency, monocyte recruitment, and lipogenesis.J Virol. 2014 Feb;88(4):2131-56. doi: 10.1128/JVI.02786-13. Epub 2013 Dec 11. J Virol. 2014. PMID: 24335295 Free PMC article.
-
Viral profiling identifies multiple subtypes of Kaposi's sarcoma.mBio. 2014 Sep 23;5(5):e01633-14. doi: 10.1128/mBio.01633-14. mBio. 2014. PMID: 25249280 Free PMC article.
References
-
- Aluigi, M. G., A. Albini, S. Carlone, L. Repetto, R. De Marchi, A. Icardi, M. Moro, D. Noonan, and R. Benelli. 1996. KSHV sequences in biopsies and cultured spindle cells of epidemic, iatrogenic and Mediterranean forms of Kaposi's sarcoma. Res. Virol. 147:267-275. - PubMed
-
- An, F. Q., N. Compitello, E. Horwitz, M. Sramkoski, E. S. Knudsen, and R. Renne. 2005. The latency-associated nuclear antigen of Kaposi's sarcoma-associated herpesvirus modulates cellular gene expression and protects lymphoid cells from p16 INK4A-induced cell cycle arrest. J. Biol. Chem. 280:3862-3874. - PubMed
-
- Bais, C., B. Santomasso, O. Coso, L. Arvanitakis, E. G. Raaka, J. S. Gutkind, A. S. Asch, E. Cesarman, E. A. Mesri, and M. C. Gershengorn. 1998. G-protein-coupled receptor of Kaposi's sarcoma-associated herpesvirus is a viral oncogene and angiogenesis activator. Nature 391:86-89. - PubMed
-
- Ballestas, M. E., P. A. Chatis, and K. M. Kaye. 1999. Efficient persistence of extrachromosomal KSHV DNA mediated by latency-associated nuclear antigen. Science 284:641-644. - PubMed
Publication types
MeSH terms
Substances
Grants and funding
- R01 CA109232/CA/NCI NIH HHS/United States
- R01 HL076810/HL/NHLBI NIH HHS/United States
- R01 DE018304/DE/NIDCR NIH HHS/United States
- CA110136/CA/NCI NIH HHS/United States
- CA109232/CA/NCI NIH HHS/United States
- CA88763/CA/NCI NIH HHS/United States
- CA73062/CA/NCI NIH HHS/United States
- R01 CA083134/CA/NCI NIH HHS/United States
- R01 CA088763/CA/NCI NIH HHS/United States
- HL076810/HL/NHLBI NIH HHS/United States
- R21 CA097939/CA/NCI NIH HHS/United States
- P5043703/PHS HHS/United States
- R03 CA110136/CA/NCI NIH HHS/United States
- R01 CA073062/CA/NCI NIH HHS/United States
- CA83134/CA/NCI NIH HHS/United States
- CA97939/CA/NCI NIH HHS/United States
LinkOut - more resources
Full Text Sources
Other Literature Sources
Medical
Molecular Biology Databases
Research Materials
Miscellaneous

