. 2005 Sep;115(9):2462-71.
doi: 10.1172/JCI23853. Epub 2005 Aug 25.

Deletion of SOCS7 leads to enhanced insulin action and enlarged islets of Langerhans

Affiliations

Deletion of SOCS7 leads to enhanced insulin action and enlarged islets of Langerhans

Alexander S Banks et al. J Clin Invest. 2005 Sep.

Abstract

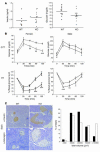
NIDDM is characterized by progressive insulin resistance and the failure of insulin-producing pancreatic beta cells to compensate for this resistance. Hyperinsulinemia, inflammation, and prolonged activation of the insulin receptor (INSR) have been shown to induce insulin resistance by decreasing INSR substrate (IRS) protein levels. Here we describe a role for SOCS7 in regulating insulin signaling. Socs7-deficient mice exhibited lower glucose levels and prolonged hypoglycemia during an insulin tolerance test and increased glucose clearance in a glucose tolerance test. Six-month-old Socs7-deficient mice exhibited increased growth of pancreatic islets with mildly increased fasting insulin levels and hypoglycemia. These defects correlated with increased IRS protein levels and enhanced insulin action in cells lacking SOCS7. Additionally, SOCS7 associated with the INSR and IRS1--molecules that are essential for normal regulation of insulin action. These data suggest that SOCS7 is a potent regulator of glucose homeostasis and insulin signaling.


Figures

Figure 1
Figure 1
Socs7 expression patterns, induction, and protein associations. (A) Socs7 mRNA expression was determined by Q PCR in 129S6 and C57BL mice fed a standard 10% fat diet ad libitum. Values are normalized relative to Hprt mRNA and plotted on a log scale. In addition to whole mouse tissues, collagenase-purified islets were also examined. Results are representative of 3 to 7 mice; error bars indicate ± SEM. *P < 0.05 between genotypes (1-tailed Student’s t test). 129S6 and C57BL/6 are indicated by light gray and dark gray bars, respectively. (B) A murine 129S6 multiple-tissue Northern blot was generated and probed with Socs7 full-length cDNA. Two bands were observed, the full-length transcript and a smaller, testis-specific (t.s.) isoform. The blot was stripped and reprobed with a Gapdh cDNA fragment as a loading control. Sk., skeletal. (C) Induction of Socs7 mRNA by insulin. Q-PCR for Socs7 in tissues isolated 1 hour after a physiological dose (0.75 U/kg) of insulin. Values are given as fold induction over level of Socs7 mRNA expression in untreated mice. Results from 4 treated (dark gray bars) and 4 untreated mice (light gray bars) are included. *P < 0.05 between stimulated and unstimulated mice of the same genotype (1-tailed Student’s t test). (D) Association of SOCS7 with insulin-signaling molecules. A full-length Socs7 cDNA was tagged with Xpress epitope and transfected into HEK293 cells with INSR or IRS1 as indicated. Immunoprecipitates of INSR or IRS1 and whole-cell lysates were blotted with an antibody recognizing SOCS7. Blots were stripped and reprobed with either antibodies against INSR or IRS1. WB, Western blot.
Figure 2
Figure 2
Targeted disruption of the Socs7 gene by homologous recombination. (A) Schematic representation of mouse Socs7 gene (top), targeting construct (middle), and targeted allele (bottom). Relevant restriction sites are indicated: Bg, BglII; H, HindIII; N, NotI; S, SalI; X, XbaI. The black boxes indicate exons. NeoR refers to the positive selection marker. The genomic fragment used as a probe for Southern blot analysis and the expected fragments after BglII digestion are indicated. (B) Southern blot analysis of BglII-digested genomic DNA from ES cell clones. The blot was hybridized with the indicated 3′ external probe. Lanes 1 and 2 show the wild-type allele from MEF and ES cells. Lanes 3–8 are from ES cells with correctly targeted alleles. (C) PCR analysis of genomic DNA from the tails of wild-type, heterozygous (Het), and knockout littermates. (D) Northern blot analysis of liver, skeletal muscle, and testis from wild-type, heterozygous, and knockout mice, showing the absence of Socs7 full-length transcript expression. (E) Growth retardation and hydrocephalus in Socs7 –/ – C57BL/6 mice. At 20 days of age, affected knockout mice exhibited a 40% decrease in weight when compared with heterozygote littermates on the C57BL/6 background (upper panel). Severe hydrocephalus is also present in a 4-week-old Socs7 –/ – mouse (lower panels). Hydrocephalus was not apparent in the mixed-background mice used in this study (image not shown).
Figure 3
Figure 3
Increased insulin sensitivity in Socs7 –/ – mice. (A) Blood glucose (right) and plasma insulin (left) concentrations in overnight-fasted wild-type and Socs7 –/ – mice aged at least 6 months. (B) Prolonged hypoglycemia in Socs7 –/ – mice following ITT and increased glucose clearance in GTT. All values are expressed as the mean ± SEM obtained from wild-type and Socs7 –/ – mice. All tests were performed on 5- to 8-month-old mice. Filled circles, wild-type mice; open circles, Socs7 –/ – mice. *P < 0.05; **P < 0.01; ***P < 0.001 (1-tailed Student’s t test). For ITT, results are given as a percentage of basal glucose concentration. (C) Increased islet size and β cell mass in Socs7 –/ – mice compared with wild-type littermates as assayed by staining with anti-insulin (upper panels) and antiglucagon antibodies (lower panels). Histogram represents the quantization of islet size performed using SPOT imaging software. Black bars, wild-type mice; white bars, Socs7 –/ – mice. Magnification, ×10.
Figure 4
Figure 4
Socs7 affects insulin signaling and IRS1 protein stability. (A) Insulin stimulation of wild-type or Socs7 –/ – mice. Six-week-old female mice were injected with a 5-unit bolus of human insulin. Soleus muscle was harvested at the times indicated. IRS1 tyrosine phosphorylation (p-Tyr) was assayed by immunoprecipitation and immunoblot. The blots were stripped and reprobed for IRS1 to assess protein loading. Relative molecular weight markers are indicated in kDa. (B) Schematic representation of SOCS7 mutants. Wild-type SOCS7 contains 4 polyproline domains (P), an SH2 domain, and a SOCS box domain (SB). The ΔN mutant lacks the 4 N-terminal polyproline domains. The ΔSB mutant contains a deletion of the C-terminal SOCS box. The R→K mutation includes 2 point mutations in the phosphotyrosine-binding domain of the SH2 domain. (C) HEK293 cells were transfected with cDNAs for ubiquitin, Irs1, and wild-type or mutant Socs7 as indicated. Forty-eight hours after transfection, cells were harvested, and immunoprecipitation and immunoblotting for IRS1 were performed. (D) HEK293 cells were transfected as in C. Then, 42 hours after transfection, cells were preincubated for 30 minutes with either 20 μM of the proteasome inhibitor MG132 (right 3 lanes) or methanol carrier as a control. Cells were then stimulated with 100 nM insulin for 6 hours before harvest and immunoprecipitation with IRS1 and immunoblot with anti-ubiquitin antibody. Whole cell lysates were blotted with an antibody recognizing SOCS7. IRS1-Ub, ubiquitinated IRS1.
Figure 5
Figure 5
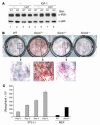
Resistance to stimulation-induced IRS1 degradation and increased adipogenesis in Socs7-deficient cells. (A) Socs7+/+ (WT) or Socs7 –/ – (KO) MEF cells were serum starved for 14–16 hours before a 30-minute pretreatment without (lanes 1, 2, 5, and 6) or with (lanes 3, 4, 7, and 8) lactacystin (Lact), a proteasome inhibitor. Cells were then stimulated with 10 nM IGF-1 for 6 hours. Immunoblotting for IRS1 was performed, followed by membrane stripping and reprobing with anti-p85 as a protein loading control. (B) Wild-type and Socs7-, Socs1-, and Socs3-deficient MEF cells were subjected to adipocyte differentiation (see Methods). Differentiation was scored either by staining for oil red O to measure triglyceride accumulation or by (C) Q-PCR for Pparg (normalized to Hprt) relative to 3T3-L1 adipocytes during differentiation.

Similar articles

Cited by

References

    1. Rice KM, Turnbow MA, Garner CW. Insulin stimulates the degradation of IRS-1 in 3T3-L1 adipocytes. Biochem. Biophys. Res. Commun. 1993;190:961–967. - PubMed
    1. Zhande R, Mitchell JJ, Wu J, Sun XJ. Molecular mechanism of insulin-induced degradation of insulin receptor substrate 1. Mol. Cell. Biol. 2002;22:1016–1026. - PMC - PubMed
    1. Sun XJ, Goldberg JL, Qiao LY, Mitchell JJ. Insulin-induced insulin receptor substrate-1 degradation is mediated by the proteasome degradation pathway. Diabetes. 1999;48:1359–1364. - PubMed
    1. Senn JJ, Klover PJ, Nowak IA, Mooney RA. Interleukin-6 induces cellular insulin resistance in hepatocytes. Diabetes. 2002;51:3391–3399. - PubMed
    1. Rui L, Fisher TL, Thomas J, White MF. Regulation of insulin/insulin-like growth factor-1 signaling by proteasome-mediated degradation of insulin receptor substrate-2. J. Biol. Chem. 2001;276:40362–40367. - PubMed

Publication types

MeSH terms