Comparative Study
. 2005 Oct 1;568(Pt 1):211-27.
doi: 10.1113/jphysiol.2005.092478. Epub 2005 Jul 28.

The mechanism of pneumolysin-induced cochlear hair cell death in the rat

Affiliations
Comparative Study

The mechanism of pneumolysin-induced cochlear hair cell death in the rat

Maryline Beurg et al. J Physiol. .

Abstract

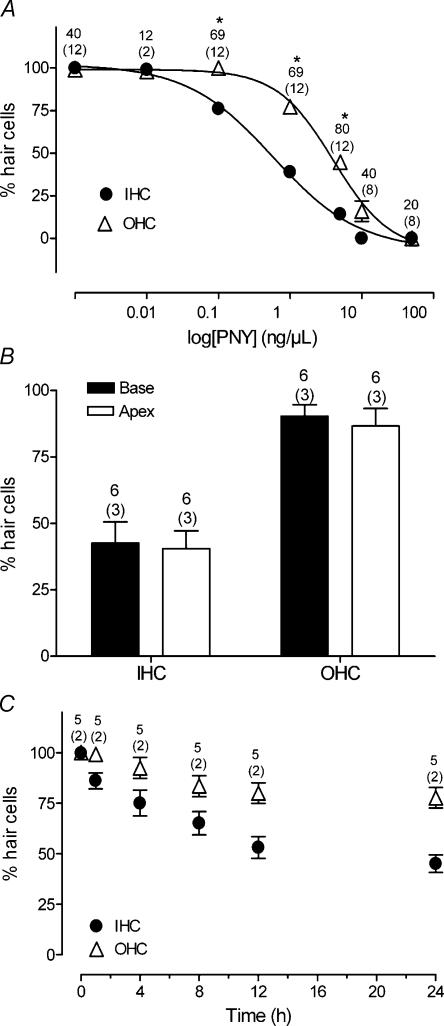
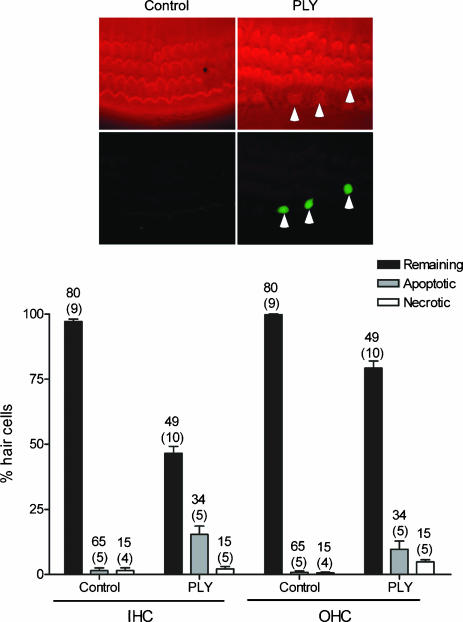
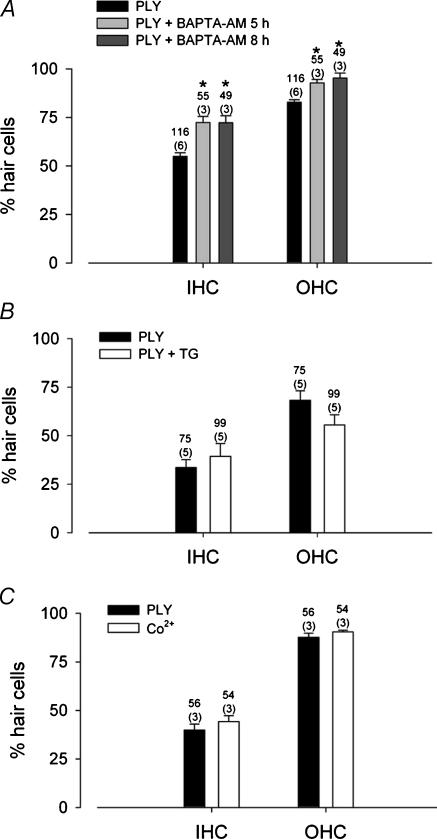
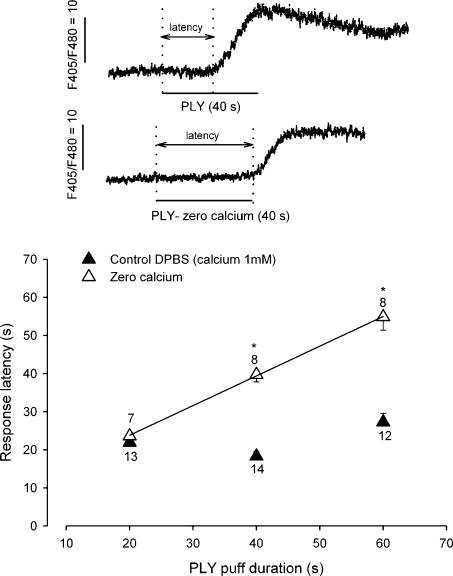
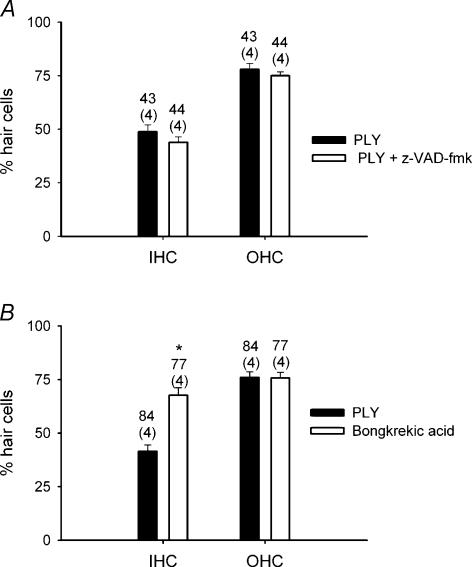
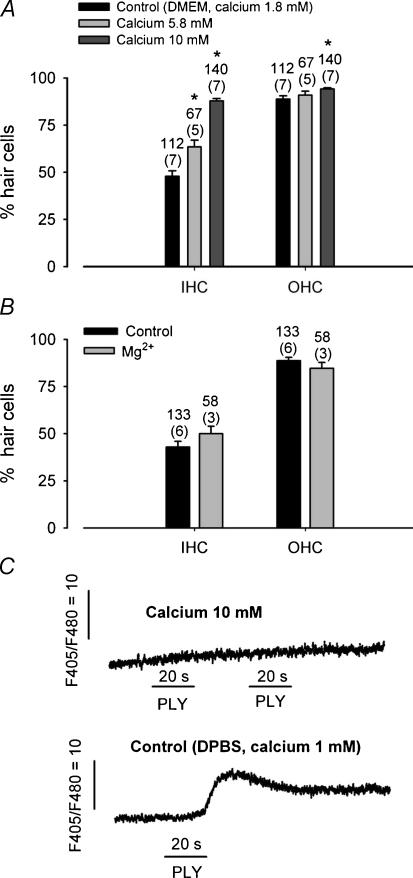
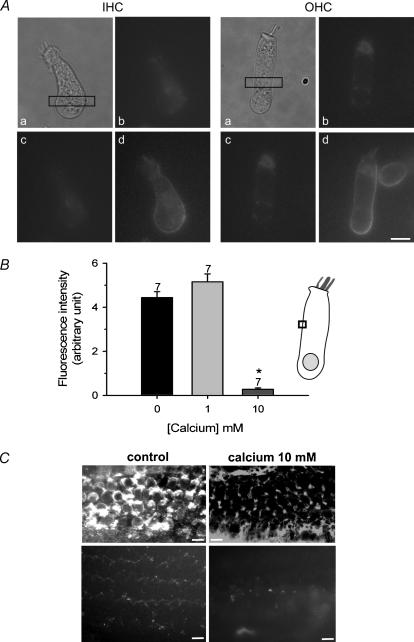
Streptoccocus pneumoniae infection can result in local and systemic diseases such as otitis media, pneumonia and meningitis. Sensorineural hearing loss associated with this infection is mediated by the release of an exotoxin, pneumolysin. The goal of the present study was to characterize the mechanisms of pneumolysin toxicity in cochlear hair cells in vitro. Pneumolysin induced severe damage in cochlear hair cells, ranging from stereocilia disorganization to total cell loss. Surprisingly, pneumolysin-induced cell death preferentially targeted inner hair cells. Pneumolysin triggered in vitro cell death by an influx of calcium. Extracellular calcium appeared to enter the cell through a pore formed by the toxin. Buffering intracellular calcium with BAPTA improved hair cell survival. The mitochondrial apoptotic pathway involved in pneumolysin-induced cell death was demonstrated by the use of bongkrekic acid. Binding of pneumolysin to the hair cell plasma membrane was required to induce cell death. Increasing external calcium reduced cell toxicity by preventing the binding of pneumolysin to hair cell membranes. These results showed the significant role of calcium both in triggering pneumolysin-induced hair cell apoptosis and in preventing the toxin from binding to its cellular target.


Figures

Figure 1
Figure 1. Dose-dependent toxicity of pneumolysin on cochlear HC in organotypic cultures
A, dose-dependent toxicity of PLY on IHC versus OHC. The percentage of phalloidin-stained HCs (with a normal hair bundle) was expressed as a function of the concentration of PLY (24 h exposure). The curves were fitted with a Hill equation and parameters were: EC50= 0.6; 4 ng μl−1 and Hill slope 0.7; 1.1 for IHC and OHC, respectively. IHCs were preferentially affected by PLY. Asterisks indicate a statistically significant different loss between IHC and OHC at the same concentration (unpaired t test, P < 0.001). B, comparison of PLY toxicity on HCs isolated from the base or the apex of the OC. C, PLY toxicity as a function of the duration of toxin (1 ng μl−1) exposure. Counts were summed across the numbers of OC explants mentioned in parenthesis. The number of fields used to determine the average of phalloidin-stained HCs corresponds to the upper numbers. Error bars show s.e.
Figure 2
Figure 2. Cell morphological changes induced by PLY in organotypic cultures
Cochlear explants were cultured 24 h with or without the toxin and examined in phalloidin-stained surface preparations (a, d, g, j) and semithin sections (b, c, e, f, h, i, ko). Control explants with normal characteristics of OHCs (O) and IHCs (I) are shown in surface preparation (a) and semithin sections (b, c). At PLY 1 ng μl1, a preferential absence or disorganization of stereocilia of IHCs is noted (d), while the majority of OHCs and Deiters' (D) cells are intact (e, f) Black arrows show HCs with a disorganized stereocilia, and open arrowheads show cells with no hair bundle. Note a tissue disorganization at the IHC level (broken lines marking cell borders) (e, f) with a loss of the tunnel of Corti (t). Apoptotic cells (white arrows) are observed. At PLY 5 ng μl−1, both IHCs and OHCs (loss and disorganization of stereocilia) are strongly affected (g, h, i). In OHCs, apoptotic features were present (shrinkage of their apical pole, presence of cytoplasmic vacuole (*)). Some IHCs were extremely damaged and some surrounding cells (s) were absent. At PLY 10 ng μl−1, no stereocilia can be observed (j). Tissue is highly disorganized with the presence of apoptotic cells (white arrows) and no recognizable HCs (k, l).Within the spiral ganglion, apoptotic neurones (eccentric nucleus, chromatin condensation, vacuoles, cell shrinkage) were observed after PLY treatment (1 ng μl−1, n; 10 ng μl−1, o) while no apoptotic cells were observed in the control explants (m). Scale bars 10 μm; v, blood vessel.
Figure 3
Figure 3. Binding of PLY in cochlear HCs
The eGFP-PLY (5 ng μl−1) was pressure puffed for 2 s on isolated rat HCs. An example of an IHC (A) and OHC (D) is shown in brightfield. Fluorescent images (B, E) were obtained 10 s after the puff of PLY on the same cell (A, D). The eGFP-PLY labelling was localized in the plasma membrane of IHCs and OHCs. Graphs (C,F) show the time course of the incorporation of eGFP-PLY in the HC plasma membrane. The fluorescence intensity was quantified by integration of a small zone shown by the rectangular box shown on the brightfield images. Fluorescence (FF0) is corrected from background fluorescence (F0). G, binding of eGFP-PLY in OC cultures (representative of four explants) treated 24 h with 1 ng μl−1 of the conjugated-toxin. A more sustained labelling in OHCs' hair bundles compared to IHCs' (arrowhead) could be observed. Note a high disorganization of the IHC stereocilia when remaining. H, I, immunolocalization of PLY in control (H) and PLY (I) (1 ng μl−1, 24 h) -treated OC cultures (representative of three explants). Surface preparation of the OC showed a staining of sterocilia and plasma membrane of IHCs and OHCs, while no labelling was observed in control cultures. Scale bars 10 μm.
Figure 4
Figure 4. PLY-induced apoptosis in HC
Apoptotic and necrotic HC are detected by staining for a TUNEL reaction or with propidium iodide, respectively. Cell death labelling is performed in OC culture 24 h in the absence (control) or presence of PLY 1 ng μl−1. The bars show the percentage of remaining, apoptotic and necrotic IHCs and OHCs. The PLY induced apoptotic cell death in both IHCs and OHCs and minor necrosis. Images illustrate OC cultures labelled with a TRITC-phalloidin (top) and TUNEL reaction (bottom). Arrowheads shows TUNEL-positive HCs. Counts were summed across the numbers of explants mentioned in parenthesis and the number of fields used is indicated by the upper numbers. Error bars show s.e.
Figure 5
Figure 5. PLY toxicity is mediated by calcium
A, intracellular buffering of calcium with BAPTA-AM reduced PLY-induced HC death. Cultures were pretreated with BAPTA-AM 5 or 8 h prior to incubation with PLY (1 ng μl−1). Data represent the number of phalloidin-labelled HCs after 24 h of incubation in PLY in the presence or absence of the calcium chelator. Asterisks indicate a statistically significant difference (unpaired t test, P < 0.001). B, thapsigargin (TG), an inhibitor of intracellular calcium store, did not prevent PLY toxicity. The histogram shows the number of phalloidin-labelled HCs after 24 h incubation of PLY in the presence or absence of TG (50 μm). C, PLY-induced HC death was not blocked by an inhibitor of voltage-dependent channels. Cobalt (50 μm) had no effect on PLY toxicity. Counts were summed across the number of OCs mentioned in parenthesis. The numbers of counted fields correspond to the upper numbers. Error bars show s.e.
Figure 6
Figure 6. PLY triggers a calcium increase in freshly isolated HC
Intracellular calcium was monitored in rat isolated HCs using indo-1 spectrofluorimetry. The PLY (10 ng μl−1) was pressure-puffed on HCs. Traces show examples of an increase in calcium induced by PLY (40 s puff) in the presence of 1 mm CaCl2 (▴, control DPBS) or prepared in zero-calcium (▵). The arrows represent the response latency, the time elapsed between the start of PLY application and the intracellular calcium elevation. The graph represents the response latency as a function of the PLY exposure (puff duration) in control conditions (▴) and in the absence of external calcium (▵). The continuous line corresponds to a linear regression having a coefficient of 0.78 in zero calcium. The means (±s.e.m.) are from the number of HCs indicated on the plot. Asterisks indicate a significant difference between calcium conditions (unpaired t test, P < 0.001).
Figure 7
Figure 7. Apoptotic pathways implicated in PLY-induced HC death
Histograms show PLY toxicity in the presence of apoptotic blockers: A, a general caspase inhibitor, z-VAD-fmk and B, a mitochondrial inhibitor, bongkrekic acid. Cultures were pretreated with z-VAD-fmk (100 μm) or bongkrekic acid (20 μm) prior to incubation with PLY (1 ng μl−1). Results are from the counts summed across the number of explants mentioned in parenthesis. Upper numbers indicated the number of fields counted to determine the average. Asterisks indicate a significant difference (unpaired t test, P < 0.001). Error bars show s.e.
Figure 8
Figure 8. Rising extracellular calcium decreases PLY toxicity
A, histogram shows the PLY toxicity as a function of the external calcium concentration. Toxicity of PLY on HCs is significantly decreased in the presence of a high external calcium concentration (5.8 and 10 mm) (unpaired t test, P < 0.001). Cultures were treated with PLY (1 ng μl−1) for 24 h. B, PLY toxicity in the presence of Mg2+. PLY (1 ng μl−1) was added to the OC cultures for 24 h in presence of control or 10 mm MgCl2. Cultures were treated with PLY (1 ng μl−1) for 24 h. Toxicity of PLY was unchanged in the presence of Mg2+. The number of explants used is indicated in parenthesis and the number of fields is indicated on the graph. C, intracellular calcium increase monitored by indo-1 in a freshly isolated IHC. PLY (10 ng μl−1) was pressure puffed for 20 s (horizontal lines) in the presence of 10 mm CaCl2 (top trace) and in control conditions (1 mm CaCl2) in the same IHC. The upper and lower traces are separated by 1 min. The presence of high external calcium concentration inhibits the PLY-induced calcium increase. Error bars show s.e.
Figure 9
Figure 9. Elevation of extracellular calcium prevents binding of eGFP-PLY to HCs
A, the eGFP-PLY (5 ng μl−1) was pressure puffed for 5 s on isolated rat IHC and OHC shown in (a). Fluorescent images before (b) and after the puff of PLY in 10 mm (c) or 1 mm (control) CaCl2 (d) in the same IHC and OHC. In the presence of 10 mm CaCl2, eGFP-PLY is not seen in the HC membrane while a strong signal is present in control conditions. B, histogram represents the intensity of eGFP-PLY fluorescence bound to the HC plasma membrane as a function of external calcium concentration. eGFP-PLY (5 ng μl−1) was pressure puffed for 5 s on isolated rat HC. Fluorescence intensity was measured in a fixed-size area of the plasma membrane, illustrated by the box in the HC scheme. Fluorescence intensity corresponds to FF0. The asterisk indicates a significant different data (unpaired t test, P < 0.001). Results are obtained over the number of indicated cells. C, top images show the immunolocalization of PLY in PLY (1 ng μl−1, 24 h) -treated OC cultures (n = 4) in the presence of control (left panel) (DMEM 1.8 mm CaCl2) or high external calcium concentration (right panel) (10 mm). Bottom images show binding of eGFP-PLY in OC cultures treated 24 h with 1 ng μl−1 in the presence of control or high external calcium concentration (representative of four explants for each condition). Surface preparation of the OC showed a staining of stereocilia and plasma membrane of IHCs and OHCs in control condition, while no labelling was observed in high calcium. Error bars show s.e. Scale bars 10 μm.
Figure 10
Figure 10. Binding of eGFP-PLY on hippocampal neurones is not reduced in the presence of high extracellular calcium
The eGFP-PLY (10 ng μl−1) was pressure puffed for 10 s on rat hippocampal neurones. Fluorescent images of two neurones are shown after the puff of PLY prepared in control conditions (DPBS, 1 mm CaCl2) (a) or in 10 mm (b) CaCl2. The histogram represents the intensity of eGFP-PLY fluorescence bound to the HC plasma membrane as a function of external calcium concentration. Fluorescence intensity was measured in a fixed-size area of the plasma membrane. Fluorescence intensity corresponds to FF0. Results were obtained over the number of indicated cells. Error bars show s.e. Scale bars 10 μm.

Similar articles

Cited by

References

    1. Alonso de Velasco E, Verheul AF, Verhoef E, Snippe H. Streptococcus pneumoniae: virulence factors, pathogene and vaccines. Microbiol Rev. 1995;59:591–603. - PMC - PubMed
    1. Alouf J. Cholesterol-binding cytolytic protein toxins. Int J Med Microbiol. 2000;290:351–356. - PubMed
    1. Andrew PW, Mitchell TJ, Morgan PJ. Relationship of structure to function in pneumolysin. Microb Drug Resist. 1997;3:11–17. - PubMed
    1. Bhatt S, Halpin C, Hsu W, Thedinger BA, Levine RA, Tuomanen E, Nadol JB. Hearing loss and pneumococcal meningitis: an animal model. Laryngoscope. 1991;101:1285–1292. - PubMed
    1. Bhatt SM, Lauretano A, Cabellos C, Halpin C, Levine RA, Xu WZ, Nadol JB, Tuomanen E. Progression of hearing loss in experimental pneumococcal meningitis: correlation with cerebrospinal fluid cytochemistry. J Infect Dis. 1993;167:675–683. - PubMed

Publication types

MeSH terms

LinkOut - more resources