Comparative Study
. 2005 May;79(10):6299-311.
doi: 10.1128/JVI.79.10.6299-6311.2005.

Distinct mechanisms of CD4+ and CD8+ T-cell activation and bystander apoptosis induced by human immunodeficiency virus type 1 virions

Affiliations
Comparative Study

Distinct mechanisms of CD4+ and CD8+ T-cell activation and bystander apoptosis induced by human immunodeficiency virus type 1 virions

Geoffrey H Holm et al. J Virol. 2005 May.

Abstract

Apoptosis of uninfected bystander T cells contributes to T-cell depletion during human immunodeficiency virus type 1 (HIV-1) infection. HIV-1 envelope/receptor interactions and immune activation have been implicated as contributors to bystander apoptosis. To better understand the relationship between T-cell activation and bystander apoptosis during HIV-1 pathogenesis, we investigated the effects of the highly cytopathic CXCR4-tropic HIV-1 variant ELI6 on primary CD4(+) and CD8(+) T cells. Infection of primary T-cell cultures with ELI6 induced CD4(+) T-cell depletion by direct cell lysis and bystander apoptosis. Exposure of primary CD4(+) and CD8(+) T cells to nonreplicating ELI6 virions induced bystander apoptosis through a Fas-independent mechanism. Bystander apoptosis of CD4(+) T cells required direct contact with virions and Env/CXCR4 binding. In contrast, the apoptosis of CD8(+) T cells was triggered by a soluble factor(s) secreted by CD4(+) T cells. HIV-1 virions activated CD4(+) and CD8(+) T cells to express CD25 and HLA-DR and preferentially induced apoptosis in CD25(+)HLA-DR(+) T cells in a CXCR4-dependent manner. Maximal levels of binding, activation, and apoptosis were induced by virions that incorporated MHC class II and B7-2 into the viral membrane. These results suggest that nonreplicating HIV-1 virions contribute to chronic immune activation and T-cell depletion during HIV-1 pathogenesis by activating CD4(+) and CD8(+) T cells, which then proceed to die via apoptosis. This mechanism may represent a viral immune evasion strategy to increase viral replication by activating target cells while killing immune effector cells that are not productively infected.


Figures
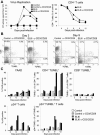
FIG. 1.
FIG. 1.
HIV-1 infection of primary T cells induces direct cell lysis and apoptosis of infected and uninfected cells. Primary T-cell cultures infected with HIV-1 ELI6 as described in Materials and Methods. Cultures were costimulated continuously with anti-CD3/CD28 antibodies or left untreated. (A) Virus replication was monitored by RT assays of culture supernatants (left panel), and the percentage of CD4+ T cells in infected cultures versus control cultures was determined by flow cytometry (right panel). (B) Flow cytometric analysis of apoptosis and CD4+ T-cell depletion. Cells from control and ELI6-infected costimulated cultures were stained on day 3 and day 9 with 7AAD, TUNEL-FITC, and CD4-PE. 7AAD-positive cells were gated out of CD4-TUNEL analysis. (C) Flow cytometric analysis of untreated control cultures (white bars), costimulated control cultures (light gray bars), untreated ELI6-infected cultures (dark gray bars), and costimulated ELI6-infected cultures (black bars). Values represent the percentages of 7AAD-positive cells (upper left panel), CD4+ and CD8+ T cells staining TUNEL positive (upper middle and right panels, respectively), p24-positive cells (lower left panel), and p24-positive cells staining TUNEL positive (lower middle panel). The gating schemes were similar to those shown in our previous study (Holm et al. [45]). Error bars in the upper right panel represent standard deviations of three separate samples. Results are representative of four independent experiments using PBMC from three different donors.
FIG. 2.
FIG. 2.
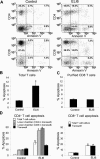
HIV-1 virions induce apoptosis in primary CD4+ and CD8+ T cells in the absence of virus replication. (A) Flow cytometric analysis of primary T-cell cultures incubated with control supernatant (left panels) or UV-inactivated ELI6 virions (right panels) for 5 days. Cultures were stained with 7AAD, annexin V-FITC, and either anti-CD4-PE (top panels) or anti-CD8-PE (bottom panels). The percentages of cells in the annexin Vintermediate and annexin Vhigh fractions are indicated. (A to D) 7AAD-positive cells were gated out of the analysis. (B) TUNEL staining in primary CD4+ and CD8+ cell cultures following incubation with UV-inactivated ELI6 for 5 days. (C) TUNEL staining in primary CD8+ cell cultures following incubation with UV-inactivated ELI6 for 5 days. (D) Annexin V staining of primary CD4+ (left panel) and CD8+ T cells (right panel) following incubation with control supernatant or ELI6 virions for 5 days. CD4+ cells were in a mixed CD4+ and CD8+ T-cell culture (white bars), incubated with virions in the lower chamber of a transwell system with either CD4+ T cells (light gray bars) or CD8+ T cells (dark gray bars) in the transwell, or in the transwell (black bars). CD8+ T cells were either in a mixed CD4+CD8+ T-cell culture (white bars) or in a transwell separated from CD4+ T cells (black bars). Cells were stained with 7AAD, anti-CD4-PE or anti-CD8-PE, and annexin V-FITC. Values represent the means and standard deviations (error bars) of triplicate samples. Results were obtained using PBMC from five different donors. *, a P value of <0.05 versus the control by Student's two-tailed t test.
FIG. 3.
FIG. 3.
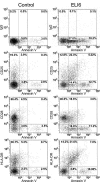
Flow cytometric analysis of primary CD4+ and CD8+ T-cell cultures incubated with control supernatant (left panels) or UV-inactivated ELI6 virions (right panels) for 5 days. Cells were stained with 7AAD and annexin V, along with control IgG-PE (top panels), anti-CD25-PE (upper middle panels), anti-CD28-PE (lower middle panels) or anti-HLA-DR-PE (bottom panels). The percentages of cells in the annexin Vintermediate and annexin Vhigh fractions are indicated. 7AAD-positive cells were gated out of the analysis. Results are representative of experiments performed using PBMC from five different donors.
FIG. 4.
FIG. 4.
HIV-1 virions activate CD4+ and CD8+ T cells. Flow cytometric analysis of primary CD4+ and CD8+ T cells incubated with control supernatant or UV-inactivated ELI6 virions for 5 days. (A) Percentage of cells incubated with control supernatant (white bars) or with ELI6 virions (black bars) staining positive for the indicated cell surface protein. (B) The n-fold increase in the ratio of annexin V+ marker+ T cells to annexin V+ marker T cells in cultures incubated with ELI6 virions compared to that of cultures incubated with control supernatant. (C) Percentage of cells incubated with control supernatant (white bars) or with ELI6 virions (black bars) staining positive for the indicated cell surface protein on CD4+ T cells (left panel) and CD8+ T cells (right panel). (D) TUNEL staining of primary T-cell cultures incubated with control supernatant or UV-inactivated ELI6 virions. Cells were preincubated for 1 h with control IgG1 antibody or anti-Fas antibody where indicated. 7AAD-positive cells were gated out of the analysis. The quantitation represents means and standard deviations (error bars) of the results of three independent experiments (A and B), five independent experiments (C), or triplicate samples (D). Results were obtained using PBMC from five different donors. *, a P value of <0.05 versus the control by Student's two-tailed t test.
FIG. 5.
FIG. 5.
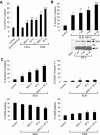
Maximal apoptosis of T cells is induced by HIV-1 virions with MHC class II and B7-2 incorporated into the viral membrane. ELI6 or ΔEnv virions were produced in CD4/HVS T cells or by transient transfection of 293T cells with or without cotransfection of plasmids expressing MHC class II and/or B7-2. -, control vector. (A) Annexin V staining of primary T-cell cultures. 7AAD-positive cells were gated out of the annexin V analysis. (B) Annexin V staining of primary T-cell cultures incubated with virions produced in 293T cells cotransfected with increasing levels of B7-2 plasmid (upper panel). B7-2 and p24 antigen in sucrose-purified 293T-produced ELI6 virion preparations were detected by Western blot analyses (lower panels). (C) Annexin V, anti-CD25, and anti-CD28 staining in primary T-cell cultures incubated with 293T-produced ELI6 virions. (Upper right panel) Total annexin V+ T cells; (upper left panel) CD25+annexin V+ T cells; (lower right panel) CD28+ T cells; (lower left panel) CD25+ T cells. Values represent means and standard deviations (error bars) of triplicate samples. Results are representative of three experiments (A and B) or five experiments (C). *, a P value of <0.05 versus the control by Student's t test; **, a P value of <0.05 versus the control and ΔEnv by Student's t test; ***, a P value of <0.05 versus the control and ELI6 by Student's two-tailed t test. Results were obtained using PBMC from four different donors.
FIG. 6.
FIG. 6.
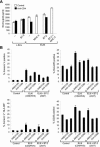
MHC class II and B7-2 incorporated into the viral envelope increase virion binding to T cells and enhance proactivation and proapoptotic signals induced by gp120/CXCR4 binding. -, control vector (A) or mock treated (B). (A) Virion binding to CD4+ T cells in the presence (black bars) or absence (white bars) of anti-CD4 was determined by p24 enzyme-linked immunosorbent assay. Values represent the amount of p24 bound to T cells following subtraction of the background, considered to be the levels of bound ΔEnv virions. Values represent means and standard deviations (error bars) of triplicate samples. Results are representative of three independent experiments. (B) Annexin V+ cells (upper left panel), HLA-DR+ cells, (upper right panel), annexin V+ HLA-DR+ cells (lower left panel), and CD25+ cells (lower right panel) in primary T-cell cultures incubated with ELI6 virions produced in CD4/HVS T cells or 293T cells cotransfected with B7-2. Cells were preincubated with AMD3100, and virions were preincubated with anti-CD86 where indicated. Values represent means and standard deviations (error bars) of duplicate samples. Results are representative of two independent experiments. Results were obtained from PBMC from five different donors.
FIG. 7.
FIG. 7.
Model for bystander CD4+ and CD8+ T-cell apoptosis induced by HIV-1 virions. HIV-1 virions bind to CD4+ T cells and induce Env-mediated signals through CXCR4 that lead to increased activation. Activated CD4+ T cells then proceed to die via apoptosis. HIV-1 virions also cause CD4+ T cells to release cytotoxic soluble factors that induce activation and apoptosis in CD8+ T cells. Env/coreceptor binding to CD4+ T cells and subsequent proactivation and proapoptotic signaling are enhanced by MHC class II and B7-2, which are incorporated into the viral membrane and bind to their cognate receptors on target cells. B7-2 incorporated into the viral membrane might also provide a costimulatory signal through CD28 that contributes to T-cell activation and apoptosis.

Similar articles

Cited by

References

    1. Algeciras, A., D. H. Dockrell, D. H. Lynch, and C. V. Paya. 1998. CD4 regulates susceptibility to Fas ligand- and tumor necrosis factor-mediated apoptosis. J. Exp. Med. 187:711-720. - PMC - PubMed
    1. Algeciras-Schimnich, A., S. R. Vlahakis, A. Villasis-Keever, T. Gomez, C. J. Heppelmann, G. Bou, and C. V. Paya. 2002. CCR5-mediates Fas- and caspase-8 dependent apoptosis of both uninfected and HIV infected primary human CD4 T cells. AIDS 16:1467-1478. - PubMed
    1. Arthur, L. O., J. W. Bess, Jr., R. C. Sowder II, R. E. Benveniste, L. E. Henderson, and J. D. Lifson. 1992. Cellular proteins bound to immunodeficiency viruses: implications for pathogenesis and vaccines. Science 258:1935-1938. - PubMed
    1. Asjo, B., D. Cefai, P. Debre, Y. Dudoit, and B. Autran. 1993. A novel mode of human immunodeficiency virus type 1 (HIV-1) activation: ligation of CD28 alone induces HIV-1 replication in naturally infected lymphocytes. J. Virol. 67:4395-4398. - PMC - PubMed
    1. Badley, A. D., D. H. Dockrell, A. Algeciras, S. Ziesmer, A. Landay, M. M. Lederman, E. Connick, H. Kessler, D. Kuritzkes, D. H. Lynch, P. Roche, H. Yagita, and C. V. Paya. 1998. In vivo analysis of Fas/FasL interactions in HIV-1 infected patients. J. Clin. Investig. 102:79-87. - PMC - PubMed

Publication types

Substances