. 2004 Dec;114(12):1704-13.
doi: 10.1172/JCI20427.

A crucial role of caspase-3 in osteogenic differentiation of bone marrow stromal stem cells

Affiliations

A crucial role of caspase-3 in osteogenic differentiation of bone marrow stromal stem cells

Masako Miura et al. J Clin Invest. 2004 Dec.

Abstract

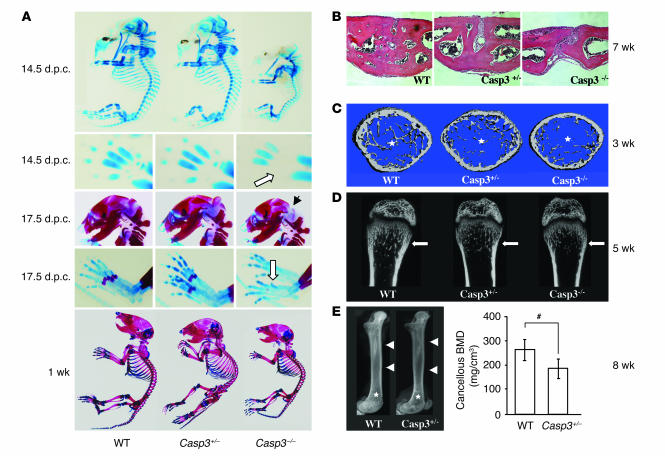
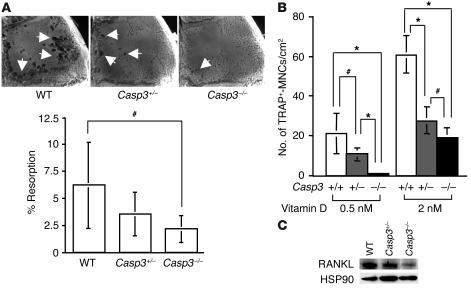
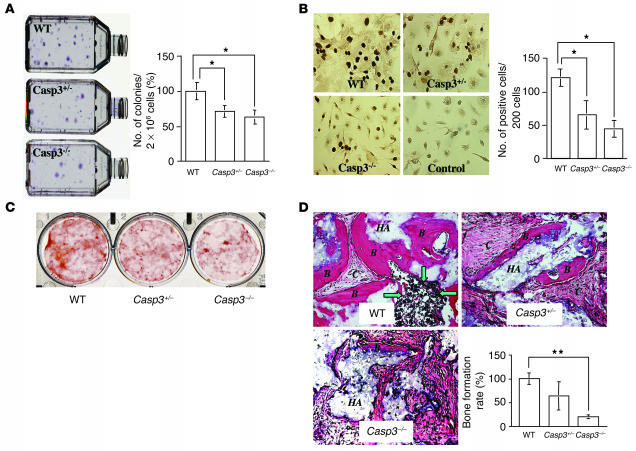
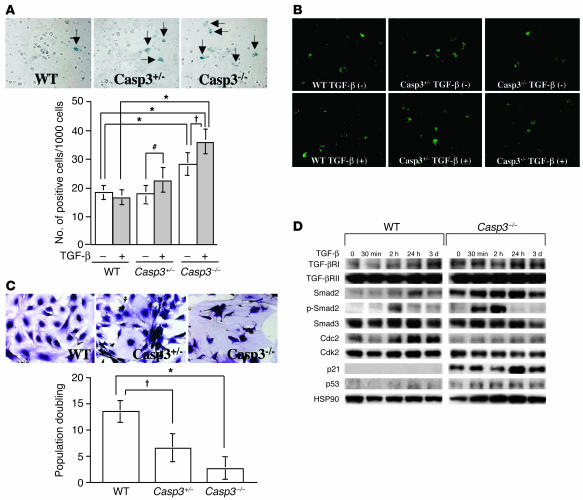
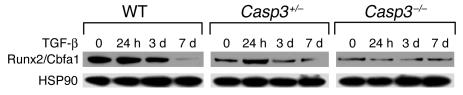
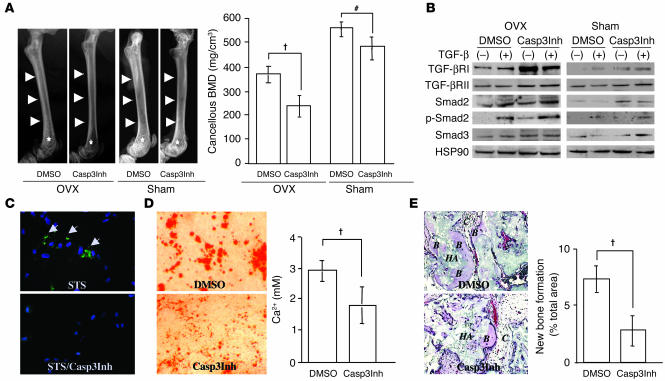
Caspase-3 is a critical enzyme for apoptosis and cell survival. Here we report delayed ossification and decreased bone mineral density in caspase-3-deficient (Casp3(-/-) and Casp3(+/-)) mice due to an attenuated osteogenic differentiation of bone marrow stromal stem cells (BMSSCs). The mechanism involved in the impaired differentiation of BMSSCs is due, at least partially, to the overactivated TGF-beta/Smad2 signaling pathway and the upregulated expressions of p53 and p21 along with the downregulated expressions of Cdk2 and Cdc2, and ultimately increased replicative senescence. In addition, the overactivated TGF-beta/Smad2 signaling may result in the compromised Runx2/Cbfa1 expression in preosteoblasts. Furthermore, we demonstrate that caspase-3 inhibitor, a potential agent for clinical treatment of human diseases, caused accelerated bone loss in ovariectomized mice, which is also associated with the overactivated TGF-beta/Smad2 signaling in BMSSCs. This study demonstrates that caspase-3 is crucial for the differentiation of BMSSCs by influencing TGF-beta/Smad2 pathway and cell cycle progression.


Figures

Figure 1
Figure 1
Skeletal defects in caspase-3–deficient mice. (A) Alizarin red and alcian blue staining of mouse skeleton at different stages. Casp3–/– mice had smaller skeletons and showed delayed development in the skull, metacarpi, phalanges, and the sternum at 14.5 d.p.c. (upper panels). White arrow shows the skeletal developmental delay on metacarpi in Casp3–/– mice. Casp3–/– mice show delayed ossification on interparietal bones (black arrow) and metatarsi (white arrow, middle panels) at 17.5 d.p.c. One-week-old Casp3–/– mice also showed a smaller skeleton (lower panel) compared with WT mice. (B) H&E staining on the sagittal suture of the anterior frontal bone at 7 weeks. The suture was completely closed in WT mice, while Casp3–/– and Casp3+/– mice showed a completely opened suture and an incomplete closure, respectively. Original magnification, ×200. (C) Trabecular bone structure of the distal femoral metaphysis at 3 weeks by microCT. Both Casp3–/– and Casp3+/– mice showed decreased trabecular bone formation (asterisks) compared with WT mice. (D) Coronal sections of the distal femoral metaphysis at 5 weeks by microCT. White arrows show the trabecular bone areas. (E) X-ray images of the femora at 8 weeks (left panel) show differences in bone density between Casp3+/– and WT mice, including cortical bone (arrowheads) and trabecular bone (asterisks). Cancellous BMD of the distal femora assessed by pQCT (right panel). pQCT also indicated significantly decreased BMD in Casp3+/– femora. Error bars represent the mean ± SD (n = 4; #P < 0.05).
Figure 2
Figure 2
Osteoclast function in caspase-3–deficient mice. (A) Representative images of titanium-induced resorption in the calvarial bones (white arrows) of WT, Casp3+/–, and Casp3–/– mice. There was a significant decrease in bone resorption in Casp3–/– mice compared with WT mice (WT, n = 12; Casp3+/–, n = 12; Casp3–/–, n = 8; #P < 0.05). (B) The number of induced TRAP+-MNCs. Spleen cells from WT mice were cocultured with preosteoblasts from WT, Casp3+/–, and Casp3–/– mice. The number of TRAP+-MNCs was significantly decreased in Casp3–/– and Casp3+/– preosteoblasts compared with WT (+/+) preosteoblasts following treatment with 0.5 nM or 2 nM 1,25(OH)2D3 (n = 6; *P < 0.001; #P < 0.05). (C) Expression of RANKL. RANKL was downregulated in Casp3–/– preosteoblasts compared with WT preosteoblasts by Western blot analysis. The expression of HSP90 is shown as a control for each protein loading.
Figure 3
Figure 3
Proliferation and osteogenic differentiation of BMSSCs in caspase-3–deficient mice. (A) Appearance of CFU-F derived from WT, Casp3+/–, and Casp3–/– mice (left). There was a significant difference in the number of colonies between caspase-3–deficient mice (Casp3–/– and Casp3+/–) and WT mice (right). Error bars represent the mean ± SD (n = 10; *P < 0.001). (B) BrdU incorporation of BMSSCs. The proliferation rate of cultured BMSSCs was assessed by BrdU incorporation assay for 24 hours. Representative pictures are shown at left. Original magnification, ×400. The number of BrdU-positive cells is indicated as a percentage of the total number of counted BMSSCs and averaged from 5 replicated cultures. Error bars represent mean ± SD (n = 5; *P < 0.001). (C) Alizarin red staining of BMSSCs cultured under the osteogenic inductive condition. Casp3–/– and Casp3+/– BMSSCs showed a lower calcium accumulation than WT BMSSCs. (D) Bone formation by BMSSCs in vivo. BMSSCs were transplanted into immunocompromised mice with HA/TCP (HA). Bone formation assessed by H&E staining was decreased in Casp3–/– and Casp3+/– transplants compared with WT transplants. B, bone; C, connective tissue; green arrows, hematopoeitic marrow elements. Original magnification, ×200. The BFR was calculated as the percentage of newly formed bone area per total area of transplant at the representative cross-sections. The graph represents mean ± SD of the percentage of WT (WT, n = 3; Casp3+/–, n = 5; Casp3–/–, n = 4; **P < 0.0001).
Figure 4
Figure 4
TGF-β–associated replicative senescence of caspase-3–deficient BMSSCs. (A) Replicative senescence assessed by β-gal staining. Representative pictures of β-gal–positive cells induced by TGF-β are shown in the upper panel (arrows). Original magnification, ×200. Replicative senescence was increased in Casp3–/– BMSSCs compared with WT BMSSCs (lower panel; n = 6; *P < 0.001). TGF-β accelerated senescence in caspase-3–deficient BMSSCs ( P < 0.01; #P < 0.05) but not in WT mice. (B) Annexin V staining of BMSSCs. The number of annexin V–positive cells was found to be similar among each genotype under the regular culture condition (–, upper panels). However, TGF-β treatment reduced the number of annexin V–positive cells in Casp3–/– BMSSCs (+, lower panels). Annexin V–positive cells appear in green. Original magnification, ×200. (C) Population doubling of BMSSCs. BMSSCs were continuously passaged at the same cell density after confluency. Fifty days after the culture was started, Casp3–/– BMSSCs stopped proliferating and showed enlarged cell body and nuclei, although WT BMSSCs continued proliferating (upper panels). Caspase-3–deficient BMSSCs showed decreased population doubling (lower panel) (n = 6; *P < 0.001; P < 0.01). (D) Western blot analysis of BMSSCs. Casp3–/– BMSSCs showed upregulated expression of TGF-βRI, Smad2, p21, and p53 along with downregulated expression of Cdc2 compared with WT. After TGF-β treatment, expression of TGF-βRI, Smad2, p-Smad2, p21, and p53 was further upregulated accompanying with downregulated expression of Cdk2 and Cdc2. Smad3 and TGF-βRII expressions were not changed in Casp3–/– BMSSCs even with TGF-β treatment. Ten micrograms of protein was applied to each lane, and HSP90 was used as an additional control for protein loading.
Figure 5
Figure 5
Runx2/Cbfa1 expression in preosteoblasts by Western blot analysis. Caspase-3–deficient (Casp3–/– and Casp3+/–) preosteoblasts showed decreased Runx2/Cbfa1 expression and altered expression pattern of Runx2/Cbfa1 in response to TGF-β treatment when compared with WT preosteoblasts.
Figure 6
Figure 6
Administration of Casp3Inh to mice and cultured human BMSSCs. (A) BMD in Casp3Inh-treated mice. X-ray images show bone density differences in femora between Casp3Inh-treated mice and DMSO-treated mice after both OVX and sham operation (left). Arrows and asterisks represent cortical and trabecular bone area in femora, respectively. pQCT analysis also showed decreased cancellous BMD of distal femora in Casp3Inh-treated mice, especially after OVX (right). Error bars represent the mean ± SD (n = 4; P < 0.01; #P <0.05). (B) Western blot analysis of human BMSSCs. Casp3Inh-treated BMSSCs showed upregulated expression of TGF-βRI and TGF-βRII compared with DMSO-treated BMSSCs, especially after OVX. After TGF-β treatment, the expression of Smad2 and p-Smad2 was increased both in Casp3Inh-OVX and DMSO-OVX BMSSCs. Even without TGF-β treatment, p-Smad2 was detectable in BMSSCs from Casp3Inh-OVX mice. (C) Caspase-3 activity in human BMSSCs. After BMSSCs were treated with staurosporin (STS), caspase-3 activity was detected (upper panel, green staining, arrows). Caspase-3 activity was not detectable with pretreatment with Casp3Inh (lower panel). Blue color represents nuclei staining with DAPI. Original magnification, ×200. (D) Alizarin red staining of human BMSSCs. BMSSCs were treated with Casp3Inh or DMSO for 24 hours and then cultured under the osteogenic inductive condition. Calcium accumulation was decreased in Casp3Inh-treated BMSSCs (left). Matrix calcium levels released by acid treatment were measured (right). Error bars represent the mean ± SD (n = 4; P < 0.01). (E) Bone formation by human BMSSCs in vivo. Bone formation assessed by H&E staining was decreased in the Casp3Inh-treated BMSSC transplant (left). Original magnification, ×200. The BFR was calculated as the percentage of newly formed bone area per total area of transplant at the representative cross-sections. Error bars represent the mean ± SD (right panel; n = 5; P < 0.01).

Similar articles

Cited by

References

    1. Strasser A, O’Connor L, Dixit VM. Apoptosis signaling. Annu. Rev. Biochem. 2000;69:217–245. - PubMed
    1. Nicholson DW. Caspase structure, proteolytic substrates, and function during apoptotic cell death. Cell Death Differ. 1999;6:1028–1042. - PubMed
    1. Kuida K, et al. Decreased apoptosis in the brain and premature lethality in CPP32-deficient mice. Nature. 1996;384:368–372. - PubMed
    1. Woo M, et al. Essential contribution of caspase 3/CPP32 to apoptosis and its associated nuclear changes. Genes Dev. 1998;12:806–819. - PMC - PubMed
    1. Kennedy NJ, Kataoka T, Tschopp J, Budd RC. Caspase activation is required for T cell proliferation. J. Exp. Med. 1999;190:1891–1896. - PMC - PubMed

Publication types

MeSH terms